Capital One 2003 Annual Report Download - page 118
Download and view the complete annual report
Please find page 118 of the 2003 Capital One annual report below. You can navigate through the pages in the report by either clicking on the pages listed below, or by using the keyword search tool below to find specific information within the annual report.-
 1
1 -
2
-
3
-
4
-
5
-
6
-
7
-
8
-
9
-
10
-
11
-
12
-
13
-
14
-
15
-
16
-
17
-
18
-
19
-
20
-
21
-
22
-
23
-
24
-
25
-
26
-
27
-
28
-
29
-
30
-
31
-
32
-
33
-
34
-
35
-
36
-
37
-
38
-
39
-
40
-
41
-
42
-
43
-
44
-
45
-
46
-
47
-
48
-
49
-
50
-
51
-
52
-
53
-
54
-
55
-
56
-
57
-
58
-
59
-
60
-
61
-
62
-
63
-
64
-
65
-
66
-
67
-
68
-
69
-
70
-
71
-
72
-
73
-
74
-
75
-
76
-
77
-
78
-
79
-
80
-
81
-
82
-
83
-
84
-
85
-
86
-
87
-
88
-
89
-
90
-
91
-
92
-
93
-
94
-
95
-
96
-
97
-
98
-
99
-
100
-
101
-
102
-
103
-
104
-
105
-
106
-
107
-
 108
108 -
 109
109 -
 110
110 -
 111
111 -
 112
112 -
 113
113 -
 114
114 -
 115
115 -
 116
116 -
 117
117 -
 118
118 -
 119
119 -
 120
120 -
 121
121 -
 122
122 -
 123
123 -
 124
124 -
 125
125 -
 126
126 -
 127
127 -
 128
128 -
129
-
130
-
131
-
132
-
133
-
134
-
135
-
136
 |
 |

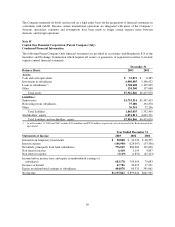
Year Ended December 31
Statements of Cash Flows 2003 2002 2001
Operating Activities:
Net income $1,135,842 $ 899,644 $ 641,965
Adjustments to reconcile net income to net cash provided by operating
activities:
Equity in undistributed earnings of subsidiaries (404,878) (69,531) (545,061)
Amortization of discount of senior notes 12,518 ——
Stock plan compensation expense 49,449 27,749 (11,134)
Decrease (increase) in other assets 53,197 50,788 (36,567)
Decrease (increase) in other liabilities 4,135 (33,328) (22,118)
Net cash provided by operating activities 850,263 875,322 27,085
Investing Activities:
Increase in investment in subsidiaries (350,000) (1,210,000) (653,202)
Increase in loans to subsidiaries (643,603) (559,774) (252,257)
Net cash used in investing activities (993,603) (1,769,774) (905,459)
Financing Activities:
(Decrease) increase in borrowings from subsidiaries (117,698) (376,598) 365,109
Issuance of senior notes 298,581 300,000 —
Issuance of mandatory convertible securities — 725,075 —
Maturities of senior notes (125,000) ——
Dividends paid (24,282) (23,457) (22,310)
Purchases of treasury stock (4,069) ——
Net proceeds from issuances of common stock 25,147 232,321 473,334
Proceeds from exercise of stock options 118,149 33,649 62,804
Net cash provided by financing activities 170,828 890,990 878,937
Increase (decrease) in cash and cash equivalents 27,488 (3,462) 563
Cash and cash equivalents at beginning of year 6,385 9,847 9,284
Cash and cash equivalents at end of year $ 33,873 $ 6,385 $ 9,847
100