Capital One 2003 Annual Report Download - page 92
Download and view the complete annual report
Please find page 92 of the 2003 Capital One annual report below. You can navigate through the pages in the report by either clicking on the pages listed below, or by using the keyword search tool below to find specific information within the annual report.-
 1
1 -
2
-
3
-
4
-
5
-
6
-
7
-
8
-
9
-
10
-
11
-
12
-
13
-
14
-
15
-
16
-
17
-
18
-
19
-
20
-
21
-
22
-
23
-
24
-
25
-
26
-
27
-
28
-
29
-
30
-
31
-
32
-
33
-
34
-
35
-
36
-
37
-
38
-
39
-
40
-
41
-
42
-
43
-
44
-
45
-
46
-
47
-
48
-
49
-
50
-
51
-
52
-
53
-
54
-
55
-
56
-
57
-
58
-
59
-
60
-
61
-
62
-
63
-
64
-
65
-
66
-
67
-
68
-
69
-
70
-
71
-
72
-
73
-
74
-
75
-
76
-
77
-
78
-
79
-
80
-
81
-
 82
82 -
 83
83 -
 84
84 -
 85
85 -
 86
86 -
 87
87 -
 88
88 -
 89
89 -
 90
90 -
 91
91 -
 92
92 -
 93
93 -
 94
94 -
 95
95 -
 96
96 -
 97
97 -
 98
98 -
 99
99 -
 100
100 -
 101
101 -
 102
102 -
103
-
104
-
105
-
106
-
107
-
108
-
109
-
110
-
111
-
112
-
113
-
114
-
115
-
116
-
117
-
118
-
119
-
120
-
121
-
122
-
123
-
124
-
125
-
126
-
127
-
128
-
129
-
130
-
131
-
132
-
133
-
134
-
135
-
136
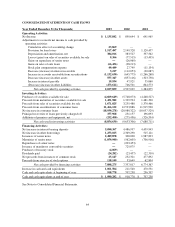
 |
 |

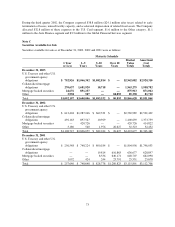
The fair value of the investments in an unrealized loss position at December 31, 2003 was $1.6 billion. Individual
investments held at December 31, 2003, have not been in an unrealized loss position for more than twelve
months. The Company has determined that these investments have only temporary impairment based on a
number of criteria, including the timeframe of the unrealized loss position, the nature of the investments and the
Company’s intent to hold the fixed income securities to maturity.
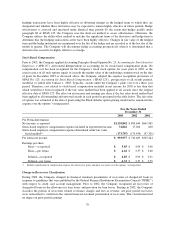
Weighted Average Yields
1Year
or Less
1–5
Years
5–10
Years
Over 10
Years
December 31, 2003
U.S. Treasury and other U.S. government agency obligations 2.05% 3.26% 4.44% —
Collateralized mortgage obligations 6.94 4.75 4.98 —
Mortgage backed securities 6.35 5.24 — —
Other 0.16 6.45 — 4.92%
Total 3.35% 4.42% 4.45% 4.92%
The distribution of mortgage-backed securities and collateralized mortgage obligations is based on average
expected maturities. Actual maturities could differ because issuers may have the right to call or prepay
obligations.
Weighted average yields were determined based on amortized cost. Gross realized gains on sales of securities
were $10.5 million, $96.9 million, and $19.1 million for the years ended December 31, 2003, 2002 and 2001,
respectively. Gross realized losses were $19.9 million, $19.4 million, and $5.6 million for the years ended
December 31, 2003, 2002 and 2001, respectively.
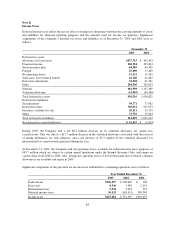
Note D
Allowance for Loan Losses
The following is a summary of changes in the allowance for loan losses:
Year Ended December 31
2003 2002 2001
Balance at beginning of year $ 1,720,000 $ 840,000 $ 527,000
Provision for loan losses 1,517,497 2,149,328 1,120,457
Other 3,863 (9,644) 14,800
Charge-offs (2,004,328) (1,490,841) (1,018,350)
Principal recoveries 357,968 231,157 196,093
Net charge-offs (1,646,360) (1,259,684) (822,257)
Balance at end of year $ 1,595,000 $ 1,720,000 $ 840,000
Loans totaling approximately $454.8 million and $567.4 million, representing amounts which were greater than
90 days past due, were included in the Company’s reported loan portfolio as of December 31, 2003 and 2002,
respectively.
74