Capital One 2003 Annual Report Download - page 64
Download and view the complete annual report
Please find page 64 of the 2003 Capital One annual report below. You can navigate through the pages in the report by either clicking on the pages listed below, or by using the keyword search tool below to find specific information within the annual report.-
 1
1 -
2
-
3
-
4
-
5
-
6
-
7
-
8
-
9
-
10
-
11
-
12
-
13
-
14
-
15
-
16
-
17
-
18
-
19
-
20
-
21
-
22
-
23
-
24
-
25
-
26
-
27
-
28
-
29
-
30
-
31
-
32
-
33
-
34
-
35
-
36
-
37
-
38
-
39
-
40
-
41
-
42
-
43
-
44
-
45
-
46
-
47
-
48
-
49
-
50
-
51
-
52
-
53
-
 54
54 -
 55
55 -
 56
56 -
 57
57 -
 58
58 -
 59
59 -
 60
60 -
 61
61 -
 62
62 -
 63
63 -
 64
64 -
 65
65 -
 66
66 -
 67
67 -
 68
68 -
 69
69 -
 70
70 -
 71
71 -
 72
72 -
 73
73 -
 74
74 -
75
-
76
-
77
-
78
-
79
-
80
-
81
-
82
-
83
-
84
-
85
-
86
-
87
-
88
-
89
-
90
-
91
-
92
-
93
-
94
-
95
-
96
-
97
-
98
-
99
-
100
-
101
-
102
-
103
-
104
-
105
-
106
-
107
-
108
-
109
-
110
-
111
-
112
-
113
-
114
-
115
-
116
-
117
-
118
-
119
-
120
-
121
-
122
-
123
-
124
-
125
-
126
-
127
-
128
-
129
-
130
-
131
-
132
-
133
-
134
-
135
-
136
 |
 |

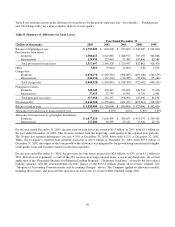
Table 8 sets forth the activity in the allowance for loan losses for the periods indicated. See “Asset Quality,” “Delinquencies”
and “Net Charge-Offs” for a more complete analysis of asset quality.
Table 8: Summary of Allowance for Loan Losses
Year Ended December 31
(Dollars in thousands) 2003 2002 2001 2000 1999
Balance at beginning of year $ 1,720,000 $ 840,000 $ 527,000 $ 342,000 $ 231,000
Provision for loan losses:
Domestic 1,388,463 2,025,885 1,048,972 705,195 364,086
International 129,034 123,443 71,485 107,666 62,384
Total provision for loan losses 1,517,497 2,149,328 1,120,457 812,861 426,470
Other 3,863 (9,644) 14,800 (549) 3,522
Charge-offs:
Domestic (1,858,176) (1,363,565) (908,065) (693,106) (344,679)
International (146,152) (127,276) (110,285) (79,296) (55,464)
Total charge-offs (2,004,328) (1,490,841) (1,018,350) (772,402) (400,143)
Principal recoveries:
Domestic 320,349 203,412 176,102 136,334 79,150
International 37,619 27,745 19,991 8,756 2,001
Total principal recoveries 357,968 231,157 196,093 145,090 81,151
Net charge-offs (1,646,360) (1,259,684) (822,257) (627,312) (318,992)
Balance at end of year $ 1,595,000 $ 1,720,000 $ 840,000 $ 527,000 $ 342,000
Allowance for loan losses to loans at end of year 4.86% 6.29% 4.02% 3.49% 3.45%
Allowance for loan losses by geographic distribution:
Domestic $ 1,477,314 1,636,405 $ 784,857 $ 451,074 $ 299,424
International 117,686 83,595 55,143 75,926 42,576
For the year ended December 31, 2003, the provision for loan losses decreased to $1.5 billion, or 29%, from $2.1 billion for
the year ended December 31, 2002. This decrease resulted from the improving credit quality of the reported loan portfolio.
The 30-plus day reported delinquency rate was 4.79% at December 31, 2003, down from 6.12% at December 31, 2002.
While, the Company’s reported loan portfolio increased to $32.9 billion at December 31, 2003 from $27.3 billion at
December 31, 2002, the impact of the loan growth to the allowance was mitigated by the growth being concentrated in higher
credit quality loans and an improvement in collection experience.
For the year ended December 31, 2002, the provision for loan losses increased to $2.1 billion, or 92%, from $1.1 billion in
2001. This increase is primarily a result of the 45% increase in average reported loans, a rise in net charge-offs, the revised
application of the “Expanded Guidance for Subprime Lending Programs” (“Subprime Guidelines”) issued by the four federal
banking agencies, and the aforementioned one-time impact of the $133.4 million change in recoveries estimate (see
“Adoption of Accounting Pronouncements and Accounting Changes” above). The Company applied its allowance models,
including these factors, and increased the allowance for loan losses by a total of $880.0 million during 2002.
46