Capital One 2003 Annual Report Download - page 78
Download and view the complete annual report
Please find page 78 of the 2003 Capital One annual report below. You can navigate through the pages in the report by either clicking on the pages listed below, or by using the keyword search tool below to find specific information within the annual report.-
 1
1 -
2
-
3
-
4
-
5
-
6
-
7
-
8
-
9
-
10
-
11
-
12
-
13
-
14
-
15
-
16
-
17
-
18
-
19
-
20
-
21
-
22
-
23
-
24
-
25
-
26
-
27
-
28
-
29
-
30
-
31
-
32
-
33
-
34
-
35
-
36
-
37
-
38
-
39
-
40
-
41
-
42
-
43
-
44
-
45
-
46
-
47
-
48
-
49
-
50
-
51
-
52
-
53
-
54
-
55
-
56
-
57
-
58
-
59
-
60
-
61
-
62
-
63
-
64
-
65
-
66
-
67
-
 68
68 -
 69
69 -
 70
70 -
 71
71 -
 72
72 -
 73
73 -
 74
74 -
 75
75 -
 76
76 -
 77
77 -
 78
78 -
 79
79 -
 80
80 -
 81
81 -
 82
82 -
 83
83 -
 84
84 -
 85
85 -
 86
86 -
 87
87 -
 88
88 -
89
-
90
-
91
-
92
-
93
-
94
-
95
-
96
-
97
-
98
-
99
-
100
-
101
-
102
-
103
-
104
-
105
-
106
-
107
-
108
-
109
-
110
-
111
-
112
-
113
-
114
-
115
-
116
-
117
-
118
-
119
-
120
-
121
-
122
-
123
-
124
-
125
-
126
-
127
-
128
-
129
-
130
-
131
-
132
-
133
-
134
-
135
-
136
 |
 |
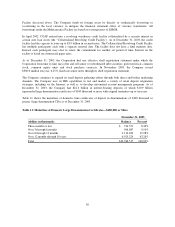
In the fourth quarter of 2002, the Company entered into a forward flow agreement with a purchaser to sell non-
prime auto receivables originated through the Company’s network of automobile dealers. These assets are sold at
a premium, servicing released with no recourse. Loans sold under this agreement are originated using the
Company’s underwriting policies. The Company sold $1.9 billion of automobile receivables, including both
prime and non-prime assets, under this and other whole loan sales agreements in 2003 and expects to sell
additional auto finance receivables in 2004.
The Company expects that in 2004 the Auto Finance segment will continue to grow as the Company continues to
diversify its loan portfolio.
Global Financial Services Segment
This segment primarily consisted of $5.4 billion of installment loan receivables, $3.3 billion of small business
receivables originated within the U.S. and $7.6 billion of credit card receivables and installment loans originated
outside of the U.S., primarily in the U.K. and Canada, as of December 31, 2003.
The improvement in the Global Financial Services segment’s financial performance in 2003 was due to the
maturation of many of the Company’s diversification businesses in the U.S., U.K. and Canada. The Company
expects that the Global Financial Services segment will continue to grow as the Company continues to diversify
its loan portfolio.
Item 7A. Quantitative and Qualitative Disclosures about Market Risk
The information required by Item 7A is included in Item 7, “Management’s Discussion and Analysis of Financial
Condition and Results of Operations—Market Risk Management” on pages 54-55.
60