Capital One 2003 Annual Report Download - page 65
Download and view the complete annual report
Please find page 65 of the 2003 Capital One annual report below. You can navigate through the pages in the report by either clicking on the pages listed below, or by using the keyword search tool below to find specific information within the annual report.-
 1
1 -
2
-
3
-
4
-
5
-
6
-
7
-
8
-
9
-
10
-
11
-
12
-
13
-
14
-
15
-
16
-
17
-
18
-
19
-
20
-
21
-
22
-
23
-
24
-
25
-
26
-
27
-
28
-
29
-
30
-
31
-
32
-
33
-
34
-
35
-
36
-
37
-
38
-
39
-
40
-
41
-
42
-
43
-
44
-
45
-
46
-
47
-
48
-
49
-
50
-
51
-
52
-
53
-
54
-
 55
55 -
 56
56 -
 57
57 -
 58
58 -
 59
59 -
 60
60 -
 61
61 -
 62
62 -
 63
63 -
 64
64 -
 65
65 -
 66
66 -
 67
67 -
 68
68 -
 69
69 -
 70
70 -
 71
71 -
 72
72 -
 73
73 -
 74
74 -
 75
75 -
76
-
77
-
78
-
79
-
80
-
81
-
82
-
83
-
84
-
85
-
86
-
87
-
88
-
89
-
90
-
91
-
92
-
93
-
94
-
95
-
96
-
97
-
98
-
99
-
100
-
101
-
102
-
103
-
104
-
105
-
106
-
107
-
108
-
109
-
110
-
111
-
112
-
113
-
114
-
115
-
116
-
117
-
118
-
119
-
120
-
121
-
122
-
123
-
124
-
125
-
126
-
127
-
128
-
129
-
130
-
131
-
132
-
133
-
134
-
135
-
136
 |
 |

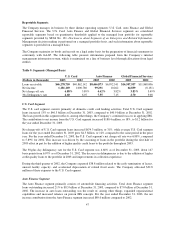
Reportable Segments
The Company manages its business by three distinct operating segments: U.S. Card, Auto Finance and Global
Financial Services. The U.S. Card, Auto Finance and Global Financial Services segments are considered
reportable segments based on quantitative thresholds applied to the managed loan portfolio for reportable
segments provided by SFAS No. 131, Disclosures about Segments of an Enterprise and Related Information.
Management decision making is performed on a managed portfolio basis, and such information about reportable
segments is provided on a managed basis.
The Company maintains its books and records on a legal entity basis for the preparation of financial statements in
conformity with GAAP. The following table presents information prepared from the Company’s internal
management information system, which is maintained on a line of business level through allocations from legal
entities.
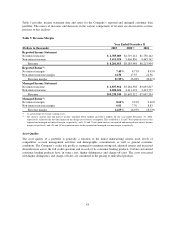
Table 9: Segments (Managed Basis)
U.S. Card Auto Finance Global Financial Services
(Dollars in thousands) 2003 2002 2003 2002 2003 2002
Loans receivable $46,278,750 $40,862,142 $8,466,873 $6,992,541 $16,507,937 $11,868,006
Net income 1,181,169 1,000,780 99,291 10,262 64,839 (8,131)
Net charge-off rate 6.88% 5.89% 4.62% 3.82% 3.83% 3.49%
30+ Delinquency rate 4.60 6.07 7.55 7.15 2.70 3.08
U.S. Card Segment
The U.S. card segment consists primarily of domestic credit card lending activities. Total U.S. Card segment
loans increased 13% to $46.3 billion at December 31, 2003, compared to $40.9 billion at December 31, 2002.
The loan growth in this segment reflects, among other things, the Company’s continued success in applying IBS.
The contribution to net income from the U.S. Card segment increased $180.4 million, or 18%, to $1.2 billion for
the year ended December 31, 2003.
Net charge-offs of U.S. Card segment loans increased $674.3 million, or 31%, while average U.S. Card segment
loans for the year ended December 31, 2003 grew $4.5 billion, or 12% compared to the same period in the prior
year. For the year ended December 31, 2003, the U.S. Card segment’s net charge-off rate was 6.88%, compared
to 5.89% for 2002. This increase was driven by the seasoning of loans in the portfolio during the first half of
2003 offset in part by the addition of higher quality credit loans to the portfolio throughout 2003.
The 30-plus day delinquency rate for the U.S. Card segment was 4.60% as of December 31, 2003, down 147
basis points from 6.07% as of December 31, 2002. The decrease in delinquencies is due to the addition of higher
credit quality loans to the portfolio in 2003 and improvements in collection experience.
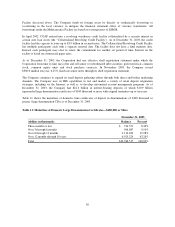
During the third quarter of 2002, the Company expensed $38.8 million related to the early termination of leases,
unused facility capacity, and accelerated depreciation of related fixed assets. The Company allocated $32.8
million of these expenses to the U.S. Card segment.
Auto Finance Segment
The Auto Finance segment primarily consists of automobile financing activities. Total Auto Finance segment
loans outstanding increased 21% to $8.5 billion at December 31, 2003, compared to $7.0 billion at December 31,
2002. The increase in auto loans outstanding was the result of, among other things, expanded organizational
capabilities and increased reliance on proven IBS concepts. For the year ended December 31, 2003, the net
income contribution from the Auto Finance segment increased $89.0 million compared to 2002.
47