Capital One 2003 Annual Report Download - page 75
Download and view the complete annual report
Please find page 75 of the 2003 Capital One annual report below. You can navigate through the pages in the report by either clicking on the pages listed below, or by using the keyword search tool below to find specific information within the annual report.-
 1
1 -
2
-
3
-
4
-
5
-
6
-
7
-
8
-
9
-
10
-
11
-
12
-
13
-
14
-
15
-
16
-
17
-
18
-
19
-
20
-
21
-
22
-
23
-
24
-
25
-
26
-
27
-
28
-
29
-
30
-
31
-
32
-
33
-
34
-
35
-
36
-
37
-
38
-
39
-
40
-
41
-
42
-
43
-
44
-
45
-
46
-
47
-
48
-
49
-
50
-
51
-
52
-
53
-
54
-
55
-
56
-
57
-
58
-
59
-
60
-
61
-
62
-
63
-
64
-
 65
65 -
 66
66 -
 67
67 -
 68
68 -
 69
69 -
 70
70 -
 71
71 -
 72
72 -
 73
73 -
 74
74 -
 75
75 -
 76
76 -
 77
77 -
 78
78 -
 79
79 -
 80
80 -
 81
81 -
 82
82 -
 83
83 -
 84
84 -
 85
85 -
86
-
87
-
88
-
89
-
90
-
91
-
92
-
93
-
94
-
95
-
96
-
97
-
98
-
99
-
100
-
101
-
102
-
103
-
104
-
105
-
106
-
107
-
108
-
109
-
110
-
111
-
112
-
113
-
114
-
115
-
116
-
117
-
118
-
119
-
120
-
121
-
122
-
123
-
124
-
125
-
126
-
127
-
128
-
129
-
130
-
131
-
132
-
133
-
134
-
135
-
136
 |
 |
management’s current expectations. Certain statements are forward looking, and therefore actual results could
differ materially. Factors that could materially influence results are set forth throughout this section and in Part I,
Item 1, Risk Factors.
Earnings Goals
The Company expects fully diluted earnings per share results of between $5.30 and $5.60 in 2004, which
represents an increase of between 9% and 15% growth over its earnings of $4.85 per share (fully diluted) in
2003.
The Company’s 2004 earnings per share estimate is based on its expectations for continued strong earnings in its
U.S. Card segment and an increasing earnings contribution from its non-U.S. card businesses. The Company
anticipates its percentage of managed loan growth rate in 2004 to be in the mid-teens, with a gradual shift
towards higher credit quality loans and a higher growth rate in its diversification businesses than its U.S.
consumer credit card business.
The Company’s earnings are a function of its revenues (net interest income and non-interest income), consumer
usage, payment and attrition patterns, the credit quality and growth rate of its earning assets (which affects fees,
charge-offs and provision expense) and the Company’s marketing and operating expenses. Specific factors likely
to affect the Company’s 2004 earnings are the pace of the shift in its loan portfolio towards higher credit quality
loans, changes in consumer payment behavior, and the level of investments in its diversification businesses.
The Company expects to achieve these results based on the continued success of its business strategies and its
current assessment of the competitive, regulatory and funding market environments that it faces (each of which is
discussed elsewhere in this document), as well as the expectation that the geographies in which the Company
competes will not experience significant consumer credit quality erosion, as might be the case in an economic
downturn or recession.
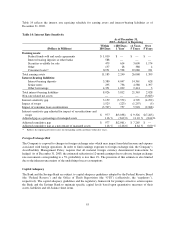
Managed Revenue Margin
The Company expects its managed revenue margin (defined as managed net interest income plus managed non-
interest income divided by managed average earning assets) to decline somewhat in 2004 as a result of the
Company’s expected continued shift in its loan portfolio towards higher credit quality loans and the increasing
diversification of its products beyond U.S. consumer credit cards. However, the Company expects that the
decline will be less than that experienced in 2003. As discussed more fully below, these higher credit quality
assets typically have higher average balances than the loans in the Company’s current portfolio and, as a result,
the Company expects its charge-offs, operating expenses and marketing expenses to be lower in 2004 than in
2003 when measured as a percentage of average managed loans outstanding.
Marketing Investment
The Company expects its marketing expense in 2004 to be higher than in 2003, subject to opportunities it
perceives in the competitive market. A portion of this marketing expense will continue to support the Company’s
efforts to build a strong brand for the Company. The Company’s “What’s in Your Wallet?” campaign has
resulted in the Company achieving brand awareness and brand equity scores among the highest in the credit card
industry, as measured by third-party firms. The Company believes the branded franchise that it is building
strengthens and enables its IBS and mass customization strategies across product lines. The Company cautions,
however, that an increase or decrease in marketing expense or brand awareness does not necessarily correlate to a
comparable increase or decrease in outstanding balances or accounts due to, among other factors, the long-term
nature of brand building, customer attrition and utilization patterns, and shifts over time in targeting consumers
and/or products that have varying marketing acquisition costs.
57