Capital One 2003 Annual Report Download - page 7
Download and view the complete annual report
Please find page 7 of the 2003 Capital One annual report below. You can navigate through the pages in the report by either clicking on the pages listed below, or by using the keyword search tool below to find specific information within the annual report.-
 1
1 -
 2
2 -
 3
3 -
 4
4 -
 5
5 -
 6
6 -
 7
7 -
 8
8 -
 9
9 -
 10
10 -
 11
11 -
 12
12 -
 13
13 -
 14
14 -
 15
15 -
 16
16 -
 17
17 -
 18
18 -
19
-
20
-
21
-
22
-
23
-
24
-
25
-
26
-
27
-
28
-
29
-
30
-
31
-
32
-
33
-
34
-
35
-
36
-
37
-
38
-
39
-
40
-
41
-
42
-
43
-
44
-
45
-
46
-
47
-
48
-
49
-
50
-
51
-
52
-
53
-
54
-
55
-
56
-
57
-
58
-
59
-
60
-
61
-
62
-
63
-
64
-
65
-
66
-
67
-
68
-
69
-
70
-
71
-
72
-
73
-
74
-
75
-
76
-
77
-
78
-
79
-
80
-
81
-
82
-
83
-
84
-
85
-
86
-
87
-
88
-
89
-
90
-
91
-
92
-
93
-
94
-
95
-
96
-
97
-
98
-
99
-
100
-
101
-
102
-
103
-
104
-
105
-
106
-
107
-
108
-
109
-
110
-
111
-
112
-
113
-
114
-
115
-
116
-
117
-
118
-
119
-
120
-
121
-
122
-
123
-
124
-
125
-
126
-
127
-
128
-
129
-
130
-
131
-
132
-
133
-
134
-
135
-
136
 |
 |

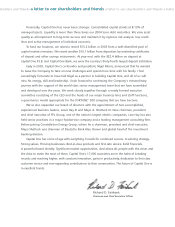
y financial summary financial summary financial summary financial summary financial summary financial summary
Percent
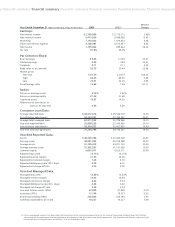
Year Ended December 31 (Dollars In Thousands, Except Per Share Data) 2003 2002(1) Change
Earnings:
Net interest income $ 2,785,089 $ 2,719,112 2.43%
Non-interest income 5,415,924 5,466,836 -0.93
Marketing 1,118,422 1,070,624 4.46
Other non-interest expense 3,738,301 3,514,957 6.35
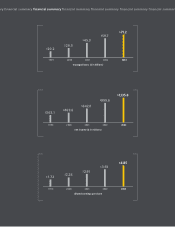
Net income 1,135,842 899,644 26.25
Tax rate 37.0% 38.0%
Per Common Share:
Basic earnings $ 5.05 $ 4.09 23.47
Diluted earnings 4.85 3.93 23.41
Dividends 0.11 0.11 0.00
Book value as of year-end 25.75 20.44 25.98
Market prices
Year-end $ 61.29 $ 29.72 106.22
High 64.25 66.50 -3.38
Low 24.91 24.05 3.58
Price/Earnings ratio 12.64 7.56 67.11
Ratios:
Return on average assets 2.76% 2.63%
Return on average equity 21.34 21.69
Capital to assets 14.87 14.55
Allowance for loan losses to
loans as of year-end 4.86 6.29
Consumer Loan Data:
Average reported loans $ 28,677,616 $ 25,036,019 14.55
Securitization adjustments 34,234,337 27,763,547 23.31
Average total managed loans 62,911,953 52,799,566 19.15
Year-end reported loans 32,850,269 27,343,930 20.14
Securitization adjustments 38,394,527 32,402,607 18.49
Year-end total managed loans 71,244,796 59,746,537 19.25
Year-End Reported Data:
Assets $ 46,283,706 $ 37,382,380 23.81
Earning assets 40,891,923 32,918,598 24.22
Average assets 41,195,413 34,201,724 20.45
Average earning assets 37,362,297 31,147,599 19.95
Common equity 6,051,811 4,623,171 30.90
Reported loan yield 13.71% 15.15%
Reported revenue margin 21.95 26.28
Reported net interest margin 7.45 8.73
Reported delinquency rate (30+ days) 4.79 6.12
Reported net charge-off rate 5.74 5.03
Year-End Managed Data:
Managed loan yield 13.88% 14.64%
Managed revenue margin 14.65 16.93
Managed net interest margin 8.64 9.23
Managed delinquency rate (30+ days) 4.46 5.60
Managed net charge-off rate 5.86 5.24
Year-end total accounts (000s) 47,038 47,369 -0.70
Associates (FTEs) 17,760 18,757 -5.32
Shares outstanding (000s) 235,042 226,195 3.91
Common stockholders of record 10,227 10,227 0.00
(1) Certain prior period amounts have been reclassified to conform to the current period presentation for the Financial Accounting Standards Board Staff Position,
“Accounting for Accrued Interest Receivable Related to Securitized and Sold Receivables under FASB Statement No. 140, Accounting for Transfers and Servicing of
Financial Assets and Extinguishments of Liabilities,” that was issued April 2003.