Capital One 2003 Annual Report Download - page 69
Download and view the complete annual report
Please find page 69 of the 2003 Capital One annual report below. You can navigate through the pages in the report by either clicking on the pages listed below, or by using the keyword search tool below to find specific information within the annual report.-
 1
1 -
2
-
3
-
4
-
5
-
6
-
7
-
8
-
9
-
10
-
11
-
12
-
13
-
14
-
15
-
16
-
17
-
18
-
19
-
20
-
21
-
22
-
23
-
24
-
25
-
26
-
27
-
28
-
29
-
30
-
31
-
32
-
33
-
34
-
35
-
36
-
37
-
38
-
39
-
40
-
41
-
42
-
43
-
44
-
45
-
46
-
47
-
48
-
49
-
50
-
51
-
52
-
53
-
54
-
55
-
56
-
57
-
58
-
 59
59 -
 60
60 -
 61
61 -
 62
62 -
 63
63 -
 64
64 -
 65
65 -
 66
66 -
 67
67 -
 68
68 -
 69
69 -
 70
70 -
 71
71 -
 72
72 -
 73
73 -
 74
74 -
 75
75 -
 76
76 -
 77
77 -
 78
78 -
 79
79 -
80
-
81
-
82
-
83
-
84
-
85
-
86
-
87
-
88
-
89
-
90
-
91
-
92
-
93
-
94
-
95
-
96
-
97
-
98
-
99
-
100
-
101
-
102
-
103
-
104
-
105
-
106
-
107
-
108
-
109
-
110
-
111
-
112
-
113
-
114
-
115
-
116
-
117
-
118
-
119
-
120
-
121
-
122
-
123
-
124
-
125
-
126
-
127
-
128
-
129
-
130
-
131
-
132
-
133
-
134
-
135
-
136
 |
 |
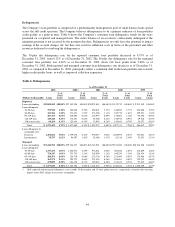
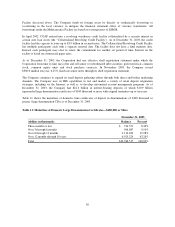
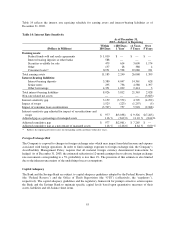
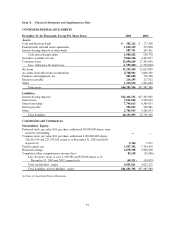
Table 12 reflects the costs of other borrowings of the Company as of and for each of the years ended December
31, 2003, 2002 and 2001.
Table 12: Short-term Borrowings
(Dollars in Thousands)
Maximum
Outstanding
as of any
Month-End
Outstanding
as of
Year-End
Average
Outstanding
Average
Interest Rate
Year-End
Interest Rate
2003:
Federal funds purchased and resale agreements $ 1,025,000 $ 45,000 $ 412,637 1.01% 0.97%
Other 1,835,238 1,152,948 1,006,804 2.82 1.81
Total $1,197,948 $ 1,419,441 2.30% 1.78%
2002:
Federal funds purchased and resale agreements $1,741,911 $ 554,887 $1,118,185 1.66% 1.26%
Other 1,418,184 897,208 844,715 2.96 2.09
Total $1,452,095 $ 1,962,900 2.22% 1.77%
2001:
Federal funds purchased and resale agreements $ 1,643,524 $ 434,024 $ 1,046,647 3.77% 1.91%
Other 616,584 449,393 224,995 7.66 2.29
Total $ 883,417 $ 1,271,642 4.46% 2.10%
Additional information regarding funding can be found on page 75 in Item 8 “Financial Statements and
Supplementary Data—Notes to the Consolidated Financial Statements—Note F”.
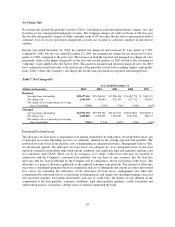
Funding Obligations
Table 13 summarizes the amounts and maturities of the contractual funding obligations of the Company,
including off-balance sheet funding.
Table 13: Funding Obligations
As of December 31, 2003
Total Up to 1 year 1-3 years 4-5 years
After 5
years
Interest-bearing deposits $22,416,332 $ 7,427,191 $ 8,652,437 $ 5,709,109 $ 627,595
Senior notes 7,016,020 1,031,272 2,791,268 1,796,451 1,397,029
Other borrowings(1) 7,796,613 3,040,336 3,883,403 869,569 3,305
Operating leases 219,586 40,041 68,264 62,408 48,873
Off-balance sheet securitization amortization 37,760,900 8,822,309 14,065,857 12,138,943 2,733,791
Total obligations $75,209,451 $20,361,149 $29,461,229 $20,576,480 $4,810,593
(1) Other borrowings includes secured borrowings for the Company’s on-balance sheet auto loan securitizations, junior subordinated capital
income securities, federal funds purchased and resale agreements and other short-term borrowings.
The terms of the lease and credit facility agreements related to certain other borrowings and operating leases in
Table 13 require several financial covenants (including performance measures and equity ratios) to be met. If
these covenants are not met, there may be an acceleration of the payment due dates noted above. As of
December 31, 2003, the Company was not in default of any such covenants.
51