Capital One 2003 Annual Report Download - page 110
Download and view the complete annual report
Please find page 110 of the 2003 Capital One annual report below. You can navigate through the pages in the report by either clicking on the pages listed below, or by using the keyword search tool below to find specific information within the annual report.-
 1
1 -
2
-
3
-
4
-
5
-
6
-
7
-
8
-
9
-
10
-
11
-
12
-
13
-
14
-
15
-
16
-
17
-
18
-
19
-
20
-
21
-
22
-
23
-
24
-
25
-
26
-
27
-
28
-
29
-
30
-
31
-
32
-
33
-
34
-
35
-
36
-
37
-
38
-
39
-
40
-
41
-
42
-
43
-
44
-
45
-
46
-
47
-
48
-
49
-
50
-
51
-
52
-
53
-
54
-
55
-
56
-
57
-
58
-
59
-
60
-
61
-
62
-
63
-
64
-
65
-
66
-
67
-
68
-
69
-
70
-
71
-
72
-
73
-
74
-
75
-
76
-
77
-
78
-
79
-
80
-
81
-
82
-
83
-
84
-
85
-
86
-
87
-
88
-
89
-
90
-
91
-
92
-
93
-
94
-
95
-
96
-
97
-
98
-
99
-
 100
100 -
 101
101 -
 102
102 -
 103
103 -
 104
104 -
 105
105 -
 106
106 -
 107
107 -
 108
108 -
 109
109 -
 110
110 -
 111
111 -
 112
112 -
 113
113 -
 114
114 -
 115
115 -
 116
116 -
 117
117 -
 118
118 -
 119
119 -
 120
120 -
121
-
122
-
123
-
124
-
125
-
126
-
127
-
128
-
129
-
130
-
131
-
132
-
133
-
134
-
135
-
136
 |
 |

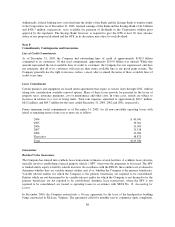
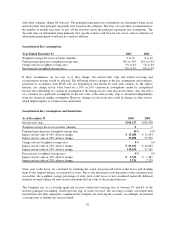
with other company charge-off forecasts. The principal repayment rate assumptions are determined using actual
and forecasted trust principal repayment rates based on the collateral. The lives of receivables are determined as
the number of months necessary to pay off the investors given the principal repayment rate assumptions. The
discount rates are determined using primarily trust specific statistics and forward rate curves, and are reflective of
what market participants would use in a similar valuation.
Securitization Key Assumptions
Year Ended December 31 2003 2002
Weighted average life for receivables (months) 9 to 10 8 to 10
Principal repayment rate (weighted average rate) 14% to 15% 13% to 15%
Charge-off rate (weighted average rate) 5% to 6% 5% to 6%
Discount rate (weighted average rate) 8% to 9% 8% to 9%
If these assumptions are not met, or if they change, the interest-only strip and related servicing and
securitizations income would be affected. The following adverse changes to the key assumptions and estimates,
presented in accordance with SFAS 140, are hypothetical and should be used with caution. As the figures
indicate, any change in fair value based on a 10% or 20% variation in assumptions cannot be extrapolated
because the relationship of a change in assumption to the change in fair value may not be linear. Also, the effect
of a variation in a particular assumption on the fair value of the interest-only strip is calculated independently
from any change in another assumption. However, changes in one factor may result in changes in other factors,
which might magnify or counteract the sensitivities.
Securitization Key Assumptions and Sensitivities
As of December 31 2003 2002
Interest-only strip $304,227 $236,398
Weighted average life for receivables (months) 99
Principal repayment rate (weighted average rate) 14% 14%
Impact on fair value of 10% adverse change $ 15,480 $ 15,353
Impact on fair value of 20% adverse change 27,898 27,252
Charge-off rate (weighted average rate) 5% 6%
Impact on fair value of 10% adverse change $ 60,261 $ 46,083
Impact on fair value of 20% adverse change 119,014 92,167
Discount rate (weighted average rate) 9% 8%
Impact on fair value of 10% adverse change $ 1,326 $ 1,387
Impact on fair value of 20% adverse change 3,226 2,733
Static pool credit losses are calculated by summing the actual and projected future credit losses and dividing
them by the original balance of each pool of assets. Due to the short-term revolving nature of the consumer loan
receivables, the weighted average percentage of static pool credit losses is not considered materially different
from the assumed charge-off rates used to determine the fair value of the retained interests.
The Company acts as a servicing agent and receives contractual servicing fees of between 2% and 6% of the
investor principal outstanding, based upon the type of assets serviced. The servicing revenues associated with
transferred receivables adequately compensate the Company for servicing the accounts. Accordingly, no material
servicing asset or liability has been recorded.
92