Capital One 2003 Annual Report Download - page 52
Download and view the complete annual report
Please find page 52 of the 2003 Capital One annual report below. You can navigate through the pages in the report by either clicking on the pages listed below, or by using the keyword search tool below to find specific information within the annual report.-
 1
1 -
2
-
3
-
4
-
5
-
6
-
7
-
8
-
9
-
10
-
11
-
12
-
13
-
14
-
15
-
16
-
17
-
18
-
19
-
20
-
21
-
22
-
23
-
24
-
25
-
26
-
27
-
28
-
29
-
30
-
31
-
32
-
33
-
34
-
35
-
36
-
37
-
38
-
39
-
40
-
41
-
 42
42 -
 43
43 -
 44
44 -
 45
45 -
 46
46 -
 47
47 -
 48
48 -
 49
49 -
 50
50 -
 51
51 -
 52
52 -
 53
53 -
 54
54 -
 55
55 -
 56
56 -
 57
57 -
 58
58 -
 59
59 -
 60
60 -
 61
61 -
 62
62 -
63
-
64
-
65
-
66
-
67
-
68
-
69
-
70
-
71
-
72
-
73
-
74
-
75
-
76
-
77
-
78
-
79
-
80
-
81
-
82
-
83
-
84
-
85
-
86
-
87
-
88
-
89
-
90
-
91
-
92
-
93
-
94
-
95
-
96
-
97
-
98
-
99
-
100
-
101
-
102
-
103
-
104
-
105
-
106
-
107
-
108
-
109
-
110
-
111
-
112
-
113
-
114
-
115
-
116
-
117
-
118
-
119
-
120
-
121
-
122
-
123
-
124
-
125
-
126
-
127
-
128
-
129
-
130
-
131
-
132
-
133
-
134
-
135
-
136
 |
 |
Adoption of Accounting Pronouncements and Accounting Changes
In December 2003, the Company adopted the expense recognition provisions of Statement of Financial
Accounting Standard No. 123 (“SFAS 123”) Accounting for Stock Based Compensation, prospectively to all
awards granted, modified or settled after January 1, 2003. The adoption of SFAS 123 resulted in the recognition
of compensation expense of $5.0 million for the year ended December 31, 2003. Compensation expense resulted
from the discounts provided under the Associate Stock Purchase Plan and the amortization of the estimated fair
value of stock options granted during 2003.
In July 2003, the Company adopted the provisions of FASB interpretation No. 46 (“FIN 46”), Consolidation of
Variable Interest Entities, an Interpretation of ARB No. 51. The Company has consolidated all material variable
interest entities (“VIEs”) for which the Company is the primary beneficiary, as defined by FIN 46. The
consolidation of the VIEs resulted in a $15.0 million ($23.9 pre-tax) charge for the cumulative effect of a change
in accounting principle.
In 2002, the Company changed its financial presentation of recoveries which resulted in a one-time increase in
the Company’s allowance for loan losses of $133.4 million, and a corresponding increase in the recognition of
interest income of $38.4 million (pre-tax) and non-interest income of $44.4 million (pre-tax). Therefore, net
income for the year ended December 31, 2002 was negatively impacted by $31.4 million after-tax.
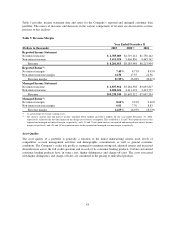
Consolidated Earnings Summary
The following discussion provides a summary of 2003 results compared to 2002 results and 2002 results
compared to 2001 results. Each component is discussed in further detail in subsequent sections of this analysis.
Year Ended December 31, 2003 Compared to Year Ended December 31, 2002
Net income increased to $1.1 billion, or $4.85 per share, for the year ended December 31, 2003, compared to net
income of $899.6 million, or $3.93 per share, in 2002. This represents 26% net income growth and 23% earnings
per share growth in 2003. The growth in earnings for 2003 was primarily attributable to the growth in the
Company’s managed loan portfolio, a reduction in the provision for loan losses and increases in the sales of auto
loans, offset in part by the adoption of new accounting pronouncements (discussed above), a reduction in the
managed net interest margin, net losses on the sale of securities and increases in marketing and operating
expenses.
Managed loans consist of the Company’s reported loan portfolio combined with the off-balance sheet securitized
loan portfolio. The Company has retained servicing rights for its securitized loans and receives servicing fees in
addition to the excess spread generated from the off-balance sheet loan portfolio. Average managed loans
increased $10.1 billion, or 19%, to $62.9 billion for 2003 from $52.8 billion for 2002.
Although the average managed loan balances increased, the managed net interest margin for the year ended
December 31, 2003, decreased to 8.64% from 9.23% for the year ended December 31, 2002. This decrease was
due to a reduction in managed earning asset yields. Managed loan yields decreased by 76 basis points to 13.88%
for the year ended December 31, 2003, from 14.64% compared to the same period in the prior year. The decrease
in managed loan yields resulted from the shift in the mix of the managed loan portfolio to higher credit quality,
lower yielding loans, an increase in low introductory rate accounts compared to the prior year and reduced
pricing on many of the Company’s new loans in response to lower funding costs and increased competitive
pressure. In addition, the Company built its average liquidity portfolio by $2.5 billion to $7.0 billion in 2003,
from $4.5 billion in 2002, placing additional downward pressure on managed earning asset yields.
For the year ended December 31, 2003, the provision for loan losses decreased to $1.5 billion from $2.1 billion
for the year ended December 31, 2002. Excluding the impact of the one-time change in recoveries estimate of
$133.4 million for the year ended December 31, 2002, the provision decreased $498.4 million, or 25%. The
decrease in the provision for loan losses reflects improving delinquency rates and lower forecasted charge-offs
34