Capital One 2003 Annual Report Download - page 56
Download and view the complete annual report
Please find page 56 of the 2003 Capital One annual report below. You can navigate through the pages in the report by either clicking on the pages listed below, or by using the keyword search tool below to find specific information within the annual report.-
 1
1 -
2
-
3
-
4
-
5
-
6
-
7
-
8
-
9
-
10
-
11
-
12
-
13
-
14
-
15
-
16
-
17
-
18
-
19
-
20
-
21
-
22
-
23
-
24
-
25
-
26
-
27
-
28
-
29
-
30
-
31
-
32
-
33
-
34
-
35
-
36
-
37
-
38
-
39
-
40
-
41
-
42
-
43
-
44
-
45
-
 46
46 -
 47
47 -
 48
48 -
 49
49 -
 50
50 -
 51
51 -
 52
52 -
 53
53 -
 54
54 -
 55
55 -
 56
56 -
 57
57 -
 58
58 -
 59
59 -
 60
60 -
 61
61 -
 62
62 -
 63
63 -
 64
64 -
 65
65 -
 66
66 -
67
-
68
-
69
-
70
-
71
-
72
-
73
-
74
-
75
-
76
-
77
-
78
-
79
-
80
-
81
-
82
-
83
-
84
-
85
-
86
-
87
-
88
-
89
-
90
-
91
-
92
-
93
-
94
-
95
-
96
-
97
-
98
-
99
-
100
-
101
-
102
-
103
-
104
-
105
-
106
-
107
-
108
-
109
-
110
-
111
-
112
-
113
-
114
-
115
-
116
-
117
-
118
-
119
-
120
-
121
-
122
-
123
-
124
-
125
-
126
-
127
-
128
-
129
-
130
-
131
-
132
-
133
-
134
-
135
-
136
 |
 |

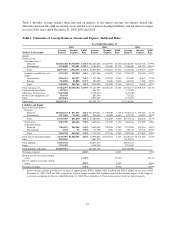
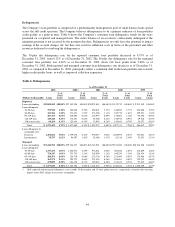
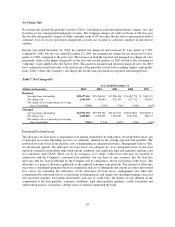
Interest Variance Analysis
Net interest income is affected by changes in the average interest rate generated on earning assets and the average
interest rate paid on interest-bearing liabilities. In addition, net interest income is affected by changes in the
volume of earning assets and interest-bearing liabilities. Table 2 sets forth the dollar amount of the increases and
decreases in interest income and interest expense resulting from changes in the volume of earning assets and
interest-bearing liabilities and from changes in yields and rates.
Table 2: Interest Variance Analysis
Year Ended December 31
2003 vs. 2002 2002 vs. 2001
Change due to(1) Change due to(1)
(Dollars in thousands)
Increase
(Decrease)(2) Volume
Yield/
Rate
Increase
(Decrease)(2) Volume
Yield/
Rate
Interest Income:
Consumer loans
Domestic $142,602 $527,384 $(348,003) $1,093,666 $1,165,559 $(108,672)
International (2,768) (4,294) 3,123 (30,724) 21,406 (53,727)
Total 139,834 516,636 (338,426) 1,062,942 1,168,600 (144,034)
Securities available for sale 8,187 59,359 (51,172) 46,219 65,981 (19,762)
Other
Domestic 28,727 72,817 (44,090) 141,353 127,956 13,397
International 10,140 11,984 (1,844) 9,103 (418) 9,521
Total 38,867 86,542 (47,675) 150,456 111,390 39,066
Total interest income 186,888 764,253 (538,989) 1,259,617 1,397,242 (176,001)
Interest Expense:
Deposits
Domestic 68,706 181,224 (112,518) 154,626 265,326 (110,700)
International 11,055 16,202 (5,147) 16,793 18,734 (1,941)
Total 79,761 197,260 (117,499) 171,419 284,347 (112,928)
Senior notes 26,117 18,638 7,479 65,034 44,260 20,774
Other borrowings
Domestic 16,040 49,775 (33,735) 80,890 135,364 (54,474)
International (1,007) (590) (417) (26,696) (20,282) (6,414)
Total 15,033 49,029 (33,996) 54,194 120,762 (66,568)
Total interest
expense 120,911 289,535 (168,624) 290,647 482,845 (192,198)
Net interest income $ 65,977 $492,017 $(387,664) $ 968,970 $ 898,085 $ 32,509
(1) The change in interest due to both volume and rates has been allocated in proportion to the relationship of the absolute dollar amounts of
the change in each. The changes in income and expense are calculated independently for each line in the table. The totals for the volume
and yield/rate columns are not the sum of the individual lines.
(2) The change in interest income includes $38.4 million related to the one-time impact of the change in recoveries assumption for the year
ended December 31, 2002.
Servicing and Securitizations Income
Servicing and securitizations income represents servicing fees, excess spread and other fees relating to consumer
loan receivables sold through securitization and other sale transactions, as well as gains and losses resulting from
securitization transactions and fair value adjustments of the retained interests. Servicing and securitizations
38