Capital One 2003 Annual Report Download - page 73
Download and view the complete annual report
Please find page 73 of the 2003 Capital One annual report below. You can navigate through the pages in the report by either clicking on the pages listed below, or by using the keyword search tool below to find specific information within the annual report.-
 1
1 -
2
-
3
-
4
-
5
-
6
-
7
-
8
-
9
-
10
-
11
-
12
-
13
-
14
-
15
-
16
-
17
-
18
-
19
-
20
-
21
-
22
-
23
-
24
-
25
-
26
-
27
-
28
-
29
-
30
-
31
-
32
-
33
-
34
-
35
-
36
-
37
-
38
-
39
-
40
-
41
-
42
-
43
-
44
-
45
-
46
-
47
-
48
-
49
-
50
-
51
-
52
-
53
-
54
-
55
-
56
-
57
-
58
-
59
-
60
-
61
-
62
-
 63
63 -
 64
64 -
 65
65 -
 66
66 -
 67
67 -
 68
68 -
 69
69 -
 70
70 -
 71
71 -
 72
72 -
 73
73 -
 74
74 -
 75
75 -
 76
76 -
 77
77 -
 78
78 -
 79
79 -
 80
80 -
 81
81 -
 82
82 -
 83
83 -
84
-
85
-
86
-
87
-
88
-
89
-
90
-
91
-
92
-
93
-
94
-
95
-
96
-
97
-
98
-
99
-
100
-
101
-
102
-
103
-
104
-
105
-
106
-
107
-
108
-
109
-
110
-
111
-
112
-
113
-
114
-
115
-
116
-
117
-
118
-
119
-
120
-
121
-
122
-
123
-
124
-
125
-
126
-
127
-
128
-
129
-
130
-
131
-
132
-
133
-
134
-
135
-
136
 |
 |

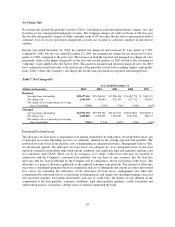
Table 14 reflects the interest rate repricing schedule for earning assets and interest-bearing liabilities as of
December 31, 2003.
Table 14: Interest Rate Sensitivity
As of December 31,
2003—Subject to Repricing
(Dollars in Millions)
Within
180 Days
>180 Days-
1Year
>1 Year-
5 Years
Over
5 Years
Earning assets:
Federal funds sold and resale agreements $ 1,010 $ — $ — $ —
Interest-bearing deposits at other banks 588 — — —
Securities available for sale 479 614 3,600 1,174
Other 157 28 388 4
Consumer loans(1) 8,951 1,598 22,080 221
Total earning assets 11,185 2,240 26,068 1,399
Interest-bearing liabilities:
Interest-bearing deposits 3,380 4,047 14,361 628
Senior notes 295 736 4,588 1,397
Other borrowings 4,351 1,029 2,414 3
Total interest-bearing liabilities 8,026 5,812 21,363 2,028
Non-rate related net assets — — — (3,663)
Interest sensitivity gap 3,159 (3,572) 4,705 (4,292)
Impact of swaps 1,525 (223) (1,297) (5)
Impact of consumer loan securitizations (3,707) 757 5,918 (2,968)
Interest sensitivity gap adjusted for impact of securitizations and
swaps $ 977 $(3,038) $ 9,326 $(7,265)
Adjusted gap as a percentage of managed assets 1.16 % (3.62)% 11.10 % (8.64)%
Adjusted cumulative gap $ 977 $(2,061) $ 7,265 $ —
Adjusted cumulative gap as a percentage of managed assets 1.16 % (2.46)% 8.64 % 0.00 %
(1) Reflects the repricing of interest rates on outstanding credit card loans within five years.
Foreign Exchange Risk
The Company is exposed to changes in foreign exchange rates which may impact translated income and expense
associated with foreign operations. In order to limit earnings exposure to foreign exchange risk, the Company’s
Asset/Liability Management Policy requires that all material foreign currency denominated transactions be
hedged. As of December 31, 2003, the estimated reduction in 12-month earnings due to adverse foreign exchange
rate movements corresponding to a 5% probability is less than 1%. The precision of this estimate is also limited
due to the inherent uncertainty of the underlying forecast assumptions.
Capital Adequacy
The Bank and the Savings Bank are subject to capital adequacy guidelines adopted by the Federal Reserve Board
(the “Federal Reserve”) and the Office of Thrift Supervision (the “OTS”) (collectively, the “regulators”),
respectively. The capital adequacy guidelines and the regulatory framework for prompt corrective action require
the Bank and the Savings Bank to maintain specific capital levels based upon quantitative measures of their
assets, liabilities and off-balance sheet items.
55