Capital One 2003 Annual Report Download - page 102
Download and view the complete annual report
Please find page 102 of the 2003 Capital One annual report below. You can navigate through the pages in the report by either clicking on the pages listed below, or by using the keyword search tool below to find specific information within the annual report.-
 1
1 -
2
-
3
-
4
-
5
-
6
-
7
-
8
-
9
-
10
-
11
-
12
-
13
-
14
-
15
-
16
-
17
-
18
-
19
-
20
-
21
-
22
-
23
-
24
-
25
-
26
-
27
-
28
-
29
-
30
-
31
-
32
-
33
-
34
-
35
-
36
-
37
-
38
-
39
-
40
-
41
-
42
-
43
-
44
-
45
-
46
-
47
-
48
-
49
-
50
-
51
-
52
-
53
-
54
-
55
-
56
-
57
-
58
-
59
-
60
-
61
-
62
-
63
-
64
-
65
-
66
-
67
-
68
-
69
-
70
-
71
-
72
-
73
-
74
-
75
-
76
-
77
-
78
-
79
-
80
-
81
-
82
-
83
-
84
-
85
-
86
-
87
-
88
-
89
-
90
-
91
-
 92
92 -
 93
93 -
 94
94 -
 95
95 -
 96
96 -
 97
97 -
 98
98 -
 99
99 -
 100
100 -
 101
101 -
 102
102 -
 103
103 -
 104
104 -
 105
105 -
 106
106 -
 107
107 -
 108
108 -
 109
109 -
 110
110 -
 111
111 -
 112
112 -
113
-
114
-
115
-
116
-
117
-
118
-
119
-
120
-
121
-
122
-
123
-
124
-
125
-
126
-
127
-
128
-
129
-
130
-
131
-
132
-
133
-
134
-
135
-
136
 |
 |

Note K
Income Taxes
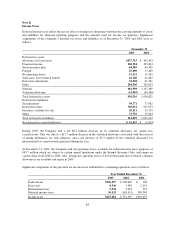
Deferred income taxes reflect the net tax effects of temporary differences between the carrying amounts of assets
and liabilities for financial reporting purposes and the amounts used for income tax purposes. Significant
components of the Company’s deferred tax assets and liabilities as of December 31, 2003 and 2002 were as
follows:
December 31
2003 2002
Deferred tax assets:
Allowance for loan losses $337,715 $ 442,393
Unearned income 260,324 323,404
Stock incentive plan 64,585 49,585
Foreign 25,890 17,469
Net operating losses 15,212 19,165
State taxes, net of federal benefit 42,140 61,649
Derivative instruments 32,228 61,491
Other 204,505 142,033
Subtotal 982,599 1,117,189
Valuation allowance (52,083) (60,368)
Total deferred tax assets 930,516 1,056,821
Deferred tax liabilities:
Securitizations 59,771 57,962
Deferred revenue 760,021 915,953
Securities available for sale 20,511 33,735
Other 73,756 53,964
Total deferred tax liabilities 914,059 1,061,614
Net deferred tax assets(liabilities) $ 16,457 $ (4,793)
During 2003, the Company had a net $8.2 million decrease in its valuation allowance for certain loss
carryforwards. This was due to a $13.7 million decrease in the valuation allowance associated with the reversal
of timing differences for state purposes, and a net increase of $5.5 million of the valuation allowance for
international loss carryforwards generated during the year.
At December 31, 2003, the Company had net operating losses available for federal income taxes purposes of
$43.7 million which are subject to certain annual limitations under the Internal Revenue Code, and expire on
various dates from 2018 to 2020. Also, foreign net operating losses of $254.0 thousand (net of related valuation
allowances) are available and expire in 2009.
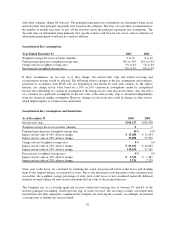
Significant components of the provision for income taxes attributable to continuing operations were as follows:
Year Ended December 31
2003 2002 2001
Federal taxes $596,397 $ 708,667 $ 138
State taxes 8,346 5,485 2,214
International taxes 5,914 2,654 555
Deferred income taxes 56,425 (165,411) 390,548
Income taxes $667,082 $ 551,395 $393,455
84