Asus 2014 Annual Report Download - page 98
Download and view the complete annual report
Please find page 98 of the 2014 Asus annual report below. You can navigate through the pages in the report by either clicking on the pages listed below, or by using the keyword search tool below to find specific information within the annual report.-
 1
1 -
2
-
3
-
4
-
5
-
6
-
7
-
8
-
9
-
10
-
11
-
12
-
13
-
14
-
15
-
16
-
17
-
18
-
19
-
20
-
21
-
22
-
23
-
24
-
25
-
26
-
27
-
28
-
29
-
30
-
31
-
32
-
33
-
34
-
35
-
36
-
37
-
38
-
39
-
40
-
41
-
42
-
43
-
44
-
45
-
46
-
47
-
48
-
49
-
50
-
51
-
52
-
53
-
54
-
55
-
56
-
57
-
58
-
59
-
60
-
61
-
62
-
63
-
64
-
65
-
66
-
67
-
68
-
69
-
70
-
71
-
72
-
73
-
74
-
75
-
76
-
77
-
78
-
79
-
80
-
81
-
82
-
83
-
84
-
85
-
86
-
87
-
 88
88 -
 89
89 -
 90
90 -
 91
91 -
 92
92 -
 93
93 -
 94
94 -
 95
95 -
 96
96 -
 97
97 -
 98
98 -
 99
99 -
 100
100 -
 101
101 -
 102
102 -
 103
103 -
 104
104 -
 105
105 -
 106
106 -
 107
107 -
 108
108 -
109
-
110
-
111
-
112
-
113
-
114
-
115
-
116
-
117
-
118
-
119
-
120
-
121
-
122
-
123
-
124
-
125
-
126
-
127
-
128
-
129
-
130
-
131
-
132
-
133
-
134
-
135
-
136
-
137
-
138
-
139
-
140
-
141
-
142
-
143
-
144
-
145
-
146
-
147
-
148
-
149
-
150
-
151
-
152
-
153
-
154
-
155
-
156
-
157
-
158
-
159
-
160
-
161
-
162
-
163
-
164
-
165
-
166
-
167
-
168
-
169
-
170
-
171
-
172
-
173
-
174
-
175
-
176
-
177
-
178
-
179
-
180
-
181
-
182
-
183
-
184
-
185
-
186
-
187
-
188
-
189
-
190
-
191
-
192
-
193
-
194
-
195
-
196
-
197
-
198
-
199
-
200
-
201
-
202
-
203
-
204
-
205
-
206
-
207
-
208
-
209
-
210
-
211
-
212
-
213
-
214
-
215
-
216
-
217
-
218
-
219
-
220
-
221
-
222
-
223
-
224
-
225
-
226
-
227
-
228
-
229
-
230
-
231
-
232
-
233
-
234
-
235
-
236
-
237
-
238
-
239
-
240
-
241
-
242
-
243
-
244
-
245
-
246
-
247
-
248
-
249
-
250
-
251
-
252
-
253
-
254
-
255
-
256
-
257
-
258
-
259
-
260
-
261
-
262
-
263
-
264
-
265
-
266
-
267
-
268
 |
 |
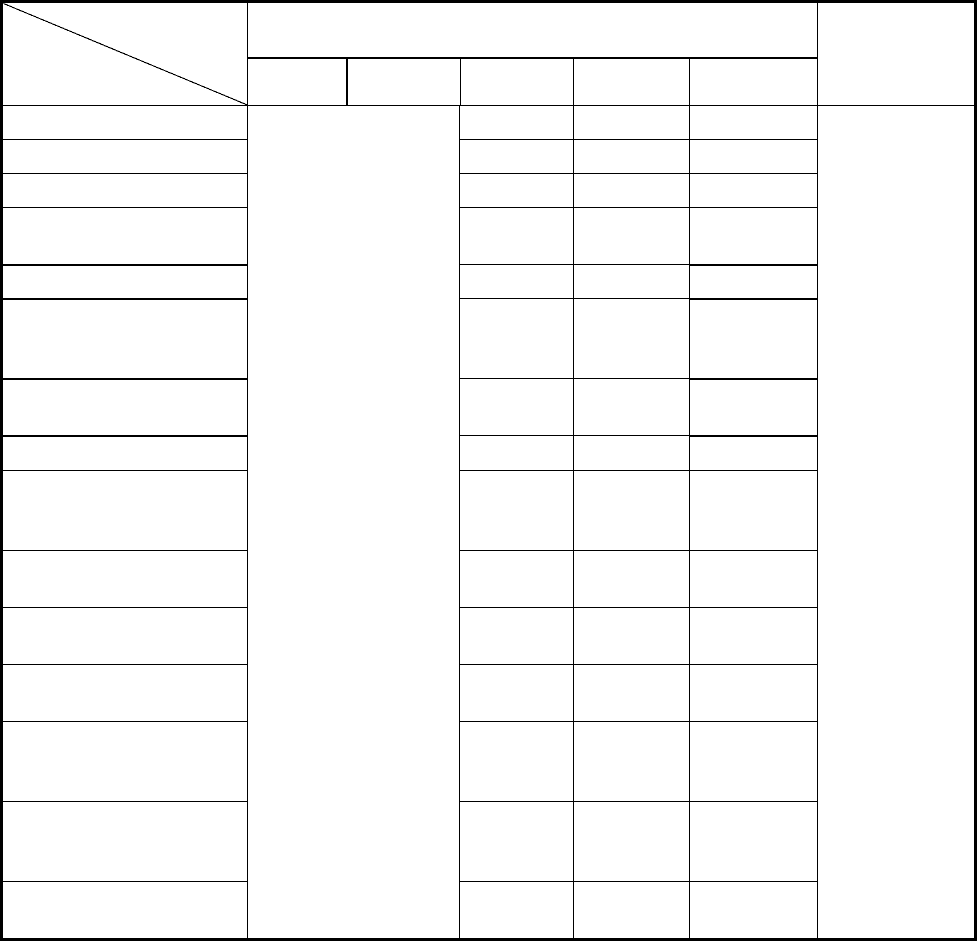
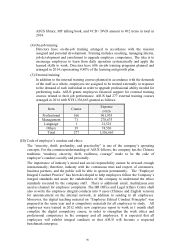
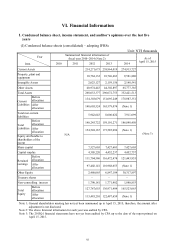
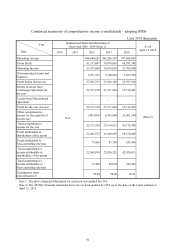
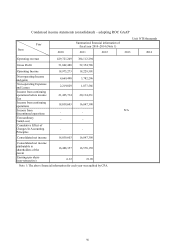
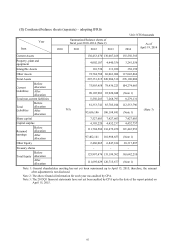
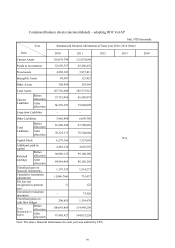
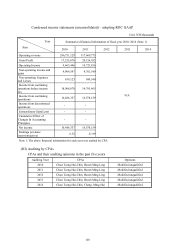
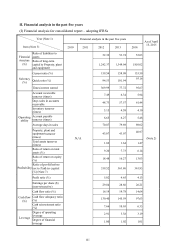
94
Condensed statements of comprehensive income (consolidated) – adopting IFRSs
Unit: NT$ thousands
Year
Item
Summarized financial information of
fiscal year 2010~2014 (Note 1) As of
April 15, 2015
2010 2011 2012 2013 2014
Operating revenue
N/A
448,684,621 463,286,507 477,408,049
(Note 2)
Gross Profit 61,117,687 59,970,065 65,383,788
Operating Income 21,831,860 19,836,010 21,709,964
Non-operating Income and
Expenses 5,231,353 7,190,092 3,687,550
Profit before income tax 27,063,213 27,026,102 25,397,514
Income (Losses) from
Continuing Operations for
the year
22,537,178 21,531,664 19,714,405
Losses from Discontinued
Operations - - -
Profit for the year (Losses) 22,537,178 21,531,664 19,714,405
Other comprehensive
income for the year(Net of
income tax)
(403,854) 4,382,949 23,461,100
Total comprehensive
income for the year 22,133,324 25,914,613 43,175,505
Profit attributable to
shareholders of the parent 22,463,572 21,449,895 19,470,409
Profit attributable to
Non-controlling interests 73,606 81,769 243,996
Total comprehensive
income attributable to
shareholders of the parent
22,061,034 25,826,521 42,926,013
Total comprehensive
income attributable to
Non-controlling interests
72,290 88,092 249,492
Earnings per share
(non-retroactive) 29.84 28.66 26.21
Note 1: The above financial information for each year was audited by CPA.
Note 2: The 2015Q1 financial statements have not yet been audited by CPA up to the date of the report printed on
April 15, 2015.