Asus 2014 Annual Report Download - page 246
Download and view the complete annual report
Please find page 246 of the 2014 Asus annual report below. You can navigate through the pages in the report by either clicking on the pages listed below, or by using the keyword search tool below to find specific information within the annual report.-
 1
1 -
2
-
3
-
4
-
5
-
6
-
7
-
8
-
9
-
10
-
11
-
12
-
13
-
14
-
15
-
16
-
17
-
18
-
19
-
20
-
21
-
22
-
23
-
24
-
25
-
26
-
27
-
28
-
29
-
30
-
31
-
32
-
33
-
34
-
35
-
36
-
37
-
38
-
39
-
40
-
41
-
42
-
43
-
44
-
45
-
46
-
47
-
48
-
49
-
50
-
51
-
52
-
53
-
54
-
55
-
56
-
57
-
58
-
59
-
60
-
61
-
62
-
63
-
64
-
65
-
66
-
67
-
68
-
69
-
70
-
71
-
72
-
73
-
74
-
75
-
76
-
77
-
78
-
79
-
80
-
81
-
82
-
83
-
84
-
85
-
86
-
87
-
88
-
89
-
90
-
91
-
92
-
93
-
94
-
95
-
96
-
97
-
98
-
99
-
100
-
101
-
102
-
103
-
104
-
105
-
106
-
107
-
108
-
109
-
110
-
111
-
112
-
113
-
114
-
115
-
116
-
117
-
118
-
119
-
120
-
121
-
122
-
123
-
124
-
125
-
126
-
127
-
128
-
129
-
130
-
131
-
132
-
133
-
134
-
135
-
136
-
137
-
138
-
139
-
140
-
141
-
142
-
143
-
144
-
145
-
146
-
147
-
148
-
149
-
150
-
151
-
152
-
153
-
154
-
155
-
156
-
157
-
158
-
159
-
160
-
161
-
162
-
163
-
164
-
165
-
166
-
167
-
168
-
169
-
170
-
171
-
172
-
173
-
174
-
175
-
176
-
177
-
178
-
179
-
180
-
181
-
182
-
183
-
184
-
185
-
186
-
187
-
188
-
189
-
190
-
191
-
192
-
193
-
194
-
195
-
196
-
197
-
198
-
199
-
200
-
201
-
202
-
203
-
204
-
205
-
206
-
207
-
208
-
209
-
210
-
211
-
212
-
213
-
214
-
215
-
216
-
217
-
218
-
219
-
220
-
221
-
222
-
223
-
224
-
225
-
226
-
227
-
228
-
229
-
230
-
231
-
232
-
233
-
234
-
235
-
 236
236 -
 237
237 -
 238
238 -
 239
239 -
 240
240 -
 241
241 -
 242
242 -
 243
243 -
 244
244 -
 245
245 -
 246
246 -
 247
247 -
 248
248 -
 249
249 -
 250
250 -
 251
251 -
 252
252 -
 253
253 -
 254
254 -
 255
255 -
 256
256 -
257
-
258
-
259
-
260
-
261
-
262
-
263
-
264
-
265
-
266
-
267
-
268
 |
 |

242
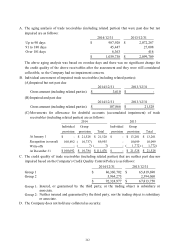
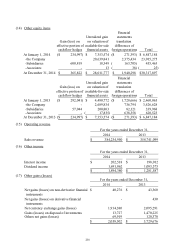
A. The aging analysis of trade receivables (including related parties) that were past due but not
impaired are as follows:
The above aging analysis was based on overdue days and there was no significant change for
the credit quality of the above receivables after the assessment and they were still considered
collectible, so the Company had no impairment concern.
B. Individual assessment of impaired trade receivables (including related parties):
(A) Impaired but not past due
(B) Impaired and past due
(C) Movements for allowance for doubtful accounts (accumulated impairment) of trade
receivables (including related parties) are as follows:
C. The credit quality of trade receivables (including related parties) that are neither past due nor
impaired based on the Company’s Credit Quality Control Policy is as follows:
Group 1:
Insured, or guaranteed by the third party, or the trading object is subsidiary or
associate.
Group 2:
Neither insured and guaranteed by the third party, nor the trading object is subsidiary
or associate.
D. The Company does not hold any collateral as security.
2014/12/31 2013/12/31
Up to 90 days 987,928$ 2,072,287$
91 to 180 days 45,447 27,008
Over 181 days 6,363 414
1,039,738$ 2,099,709$
2014/12/31 2013/12/31
Gross amount (including related parties) 3,610$ -$
2014/12/31 2013/12/31
Gross amount (including related parties) 107,866$ 21,528$
Individual Group Individual Group
provision provision Total provision provision Total
At January 1 -$ 21,528$ 21,528$ -$ 13,201$ 13,201$
Recognition (reversal) 100,692 10,737)( 89,955 - 10,099 10,099
Write-offs - 7)( 7)( - 1,772)( 1,772)(
At December 31 100,692$ 10,784$ 111,476$ -$ 21,528$ 21,528$
2014
2013
2014/12/31 2013/12/31
Group 1 86,360,702$ 65,419,690$
Group 2 5,964,275 2,394,060
92,324,977$ 67,813,750$