Asus 2014 Annual Report Download - page 266
Download and view the complete annual report
Please find page 266 of the 2014 Asus annual report below. You can navigate through the pages in the report by either clicking on the pages listed below, or by using the keyword search tool below to find specific information within the annual report.-
 1
1 -
2
-
3
-
4
-
5
-
6
-
7
-
8
-
9
-
10
-
11
-
12
-
13
-
14
-
15
-
16
-
17
-
18
-
19
-
20
-
21
-
22
-
23
-
24
-
25
-
26
-
27
-
28
-
29
-
30
-
31
-
32
-
33
-
34
-
35
-
36
-
37
-
38
-
39
-
40
-
41
-
42
-
43
-
44
-
45
-
46
-
47
-
48
-
49
-
50
-
51
-
52
-
53
-
54
-
55
-
56
-
57
-
58
-
59
-
60
-
61
-
62
-
63
-
64
-
65
-
66
-
67
-
68
-
69
-
70
-
71
-
72
-
73
-
74
-
75
-
76
-
77
-
78
-
79
-
80
-
81
-
82
-
83
-
84
-
85
-
86
-
87
-
88
-
89
-
90
-
91
-
92
-
93
-
94
-
95
-
96
-
97
-
98
-
99
-
100
-
101
-
102
-
103
-
104
-
105
-
106
-
107
-
108
-
109
-
110
-
111
-
112
-
113
-
114
-
115
-
116
-
117
-
118
-
119
-
120
-
121
-
122
-
123
-
124
-
125
-
126
-
127
-
128
-
129
-
130
-
131
-
132
-
133
-
134
-
135
-
136
-
137
-
138
-
139
-
140
-
141
-
142
-
143
-
144
-
145
-
146
-
147
-
148
-
149
-
150
-
151
-
152
-
153
-
154
-
155
-
156
-
157
-
158
-
159
-
160
-
161
-
162
-
163
-
164
-
165
-
166
-
167
-
168
-
169
-
170
-
171
-
172
-
173
-
174
-
175
-
176
-
177
-
178
-
179
-
180
-
181
-
182
-
183
-
184
-
185
-
186
-
187
-
188
-
189
-
190
-
191
-
192
-
193
-
194
-
195
-
196
-
197
-
198
-
199
-
200
-
201
-
202
-
203
-
204
-
205
-
206
-
207
-
208
-
209
-
210
-
211
-
212
-
213
-
214
-
215
-
216
-
217
-
218
-
219
-
220
-
221
-
222
-
223
-
224
-
225
-
226
-
227
-
228
-
229
-
230
-
231
-
232
-
233
-
234
-
235
-
236
-
237
-
238
-
239
-
240
-
241
-
242
-
243
-
244
-
245
-
246
-
247
-
248
-
249
-
250
-
251
-
252
-
253
-
254
-
255
-
 256
256 -
 257
257 -
 258
258 -
 259
259 -
 260
260 -
 261
261 -
 262
262 -
 263
263 -
 264
264 -
 265
265 -
 266
266 -
 267
267 -
 268
268
 |
 |

262
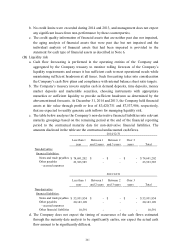
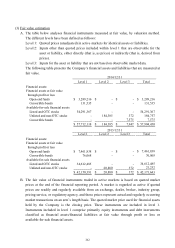
(3) Fair value estimation
A. The table below analyses financial instruments measured at fair value, by valuation method.
The different levels have been defined as follows:
Level 1:
Quoted prices (unadjusted) in active markets for identical assets or liabilities.
Level 2:
Inputs other than quoted prices included within level 1 that are observable for the
asset or liability, either directly (that is, as prices) or indirectly (that is, derived from
prices).
Level 3:
Inputs for the asset or liability that are not based on observable market data.
The following table presents the Company’s financial assets and liabilities that are measured at
fair value.
B. The fair value of financial instruments traded in active markets is based on quoted market
prices at the end of the financial reporting period. A market is regarded as active if quoted
prices are readily and regularly available from an exchange, dealer, broker, industry group,
pricing service, or regulatory agency, and those prices represent actual and regularly occurring
market transactions on an arm’s length basis. The quoted market price used for financial assets
held by the Company is the closing price. These instruments are included in level 1.
Instruments included in level 1 comprise primarily equity instruments and debt instruments
classified as financial assets/financial liabilities at fair value through profit or loss or
available-for-sale financial assets.
Level 1 Level 2 Level 3 Total
Financial assets:
Financial assets at fair value
through profit or loss
Open-end funds 3,289,216$ -$ -$ 3,289,216$
Convertible bonds 131,535 - - 131,535
Available-for-sale financial assets
Listed and OTC stocks 54,291,367 - - 54,291,367
Unlisted and non-OTC stocks - 184,385 372 184,757
Convertible bonds - - 7,575 7,575
57,712,118$ 184,385$ 7,947$ 57,904,450$
2014/12/31
Level 1 Level 2 Level 3 Total
Financial assets:
Financial assets at fair value
through profit or loss
Open-end funds 7,461,838$ -$ -$ 7,461,838$
Convertible bonds 76,068 - - 76,068
Available-for-sale financial assets
Listed and OTC stocks 34,612,485 - - 34,612,485
Unlisted and non-OTC stocks - 20,880 372 21,252
42,150,391$ 20,880$ 372$ 42,171,643$
2013/12/31