Asus 2014 Annual Report Download - page 214
Download and view the complete annual report
Please find page 214 of the 2014 Asus annual report below. You can navigate through the pages in the report by either clicking on the pages listed below, or by using the keyword search tool below to find specific information within the annual report.-
 1
1 -
2
-
3
-
4
-
5
-
6
-
7
-
8
-
9
-
10
-
11
-
12
-
13
-
14
-
15
-
16
-
17
-
18
-
19
-
20
-
21
-
22
-
23
-
24
-
25
-
26
-
27
-
28
-
29
-
30
-
31
-
32
-
33
-
34
-
35
-
36
-
37
-
38
-
39
-
40
-
41
-
42
-
43
-
44
-
45
-
46
-
47
-
48
-
49
-
50
-
51
-
52
-
53
-
54
-
55
-
56
-
57
-
58
-
59
-
60
-
61
-
62
-
63
-
64
-
65
-
66
-
67
-
68
-
69
-
70
-
71
-
72
-
73
-
74
-
75
-
76
-
77
-
78
-
79
-
80
-
81
-
82
-
83
-
84
-
85
-
86
-
87
-
88
-
89
-
90
-
91
-
92
-
93
-
94
-
95
-
96
-
97
-
98
-
99
-
100
-
101
-
102
-
103
-
104
-
105
-
106
-
107
-
108
-
109
-
110
-
111
-
112
-
113
-
114
-
115
-
116
-
117
-
118
-
119
-
120
-
121
-
122
-
123
-
124
-
125
-
126
-
127
-
128
-
129
-
130
-
131
-
132
-
133
-
134
-
135
-
136
-
137
-
138
-
139
-
140
-
141
-
142
-
143
-
144
-
145
-
146
-
147
-
148
-
149
-
150
-
151
-
152
-
153
-
154
-
155
-
156
-
157
-
158
-
159
-
160
-
161
-
162
-
163
-
164
-
165
-
166
-
167
-
168
-
169
-
170
-
171
-
172
-
173
-
174
-
175
-
176
-
177
-
178
-
179
-
180
-
181
-
182
-
183
-
184
-
185
-
186
-
187
-
188
-
189
-
190
-
191
-
192
-
193
-
194
-
195
-
196
-
197
-
198
-
199
-
200
-
201
-
202
-
203
-
 204
204 -
 205
205 -
 206
206 -
 207
207 -
 208
208 -
 209
209 -
 210
210 -
 211
211 -
 212
212 -
 213
213 -
 214
214 -
 215
215 -
 216
216 -
 217
217 -
 218
218 -
 219
219 -
 220
220 -
 221
221 -
 222
222 -
 223
223 -
 224
224 -
225
-
226
-
227
-
228
-
229
-
230
-
231
-
232
-
233
-
234
-
235
-
236
-
237
-
238
-
239
-
240
-
241
-
242
-
243
-
244
-
245
-
246
-
247
-
248
-
249
-
250
-
251
-
252
-
253
-
254
-
255
-
256
-
257
-
258
-
259
-
260
-
261
-
262
-
263
-
264
-
265
-
266
-
267
-
268
 |
 |

210
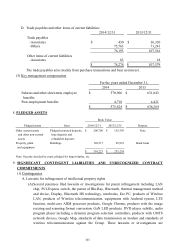
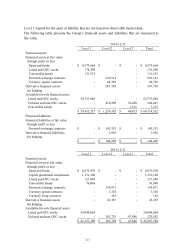
available-for-sale financial assets would have increased by $549,765 and $351,776,
respectively. The Group is exposed to equity securities price risk because of investments
held by the Group and classified on the consolidated balance sheet either as
available-for-sale or at fair value through profit or loss. The Group has no price risk of
merchandise inventories. To manage its price risk arising from investments in equity
securities, the Group diversifies its portfolio. Diversification of the portfolio is done in
accordance with the limits set by the Group.
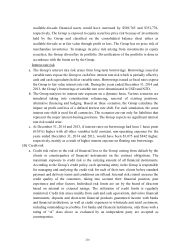
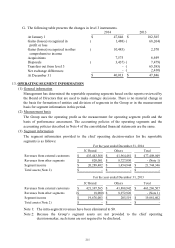
Interest rate risk
a. The Group’s interest rate risk arises from long-term borrowings. Borrowings issued at
variable rates expose the Group to cash flow interest rate risk which is partially offset by
cash and cash equivalents held at variable rates. Borrowings issued at fixed rates expose
the Group to fair value interest rate risk. During the years ended December 31, 2014 and
2013, the Group’s borrowings at variable rate were denominated in USD and NTD.
b. The Group analyses its interest rate exposure on a dynamic basis. Various scenarios are
simulated taking into consideration refinancing, renewal of existing positions,
alternative financing and hedging. Based on these scenarios, the Group calculates the
impact on profit and loss of a defined interest rate shift. For each simulation, the same
interest rate shift is used for all currencies. The scenarios are run only for liabilities that
represent the major interest-bearing positions. The Group expects no significant interest
rate risk would arise.
c. At December 31, 2014 and 2013, if interest rates on borrowings had been 1 basis point
(0.01%) higher with all other variables held constant, non-operating expenses for the
years ended December 31, 2014 and 2013, would have been $1,075 and $842 higher,
respectively, mainly as a result of higher interest expense on floating rate borrowings.
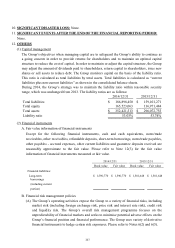
(B) Credit risk
a. Credit risk refers to the risk of financial loss to the Group arising from default by the
clients or counterparties of financial instruments on the contract obligations. The
maximum exposure to credit risk is the carrying amount of all financial instruments.
According to the Group’s credit policy, each operating entity in the Group is responsible
for managing and analysing the credit risk for each of their new clients before standard
payment and delivery terms and conditions are offered. Internal risk control assesses the
credit quality of the customers, taking into account their financial position, past
experience and other factors. Individual risk limits are set by the board of directors
based on internal or external ratings. The utilization of credit limits is regularly
monitored. Credit risk arises mainly from cash and cash equivalents, derivative financial
instruments, deposits and short-term financial products guaranteed income with banks
and financial institutions, as well as credit exposures to wholesale and retail customers,
including outstanding receivables. For banks and financial institutions, only those with a
rating of “A” class above as evaluated by an independent party are accepted as
counterparties.