Asus 2014 Annual Report Download - page 157
Download and view the complete annual report
Please find page 157 of the 2014 Asus annual report below. You can navigate through the pages in the report by either clicking on the pages listed below, or by using the keyword search tool below to find specific information within the annual report.-
 1
1 -
2
-
3
-
4
-
5
-
6
-
7
-
8
-
9
-
10
-
11
-
12
-
13
-
14
-
15
-
16
-
17
-
18
-
19
-
20
-
21
-
22
-
23
-
24
-
25
-
26
-
27
-
28
-
29
-
30
-
31
-
32
-
33
-
34
-
35
-
36
-
37
-
38
-
39
-
40
-
41
-
42
-
43
-
44
-
45
-
46
-
47
-
48
-
49
-
50
-
51
-
52
-
53
-
54
-
55
-
56
-
57
-
58
-
59
-
60
-
61
-
62
-
63
-
64
-
65
-
66
-
67
-
68
-
69
-
70
-
71
-
72
-
73
-
74
-
75
-
76
-
77
-
78
-
79
-
80
-
81
-
82
-
83
-
84
-
85
-
86
-
87
-
88
-
89
-
90
-
91
-
92
-
93
-
94
-
95
-
96
-
97
-
98
-
99
-
100
-
101
-
102
-
103
-
104
-
105
-
106
-
107
-
108
-
109
-
110
-
111
-
112
-
113
-
114
-
115
-
116
-
117
-
118
-
119
-
120
-
121
-
122
-
123
-
124
-
125
-
126
-
127
-
128
-
129
-
130
-
131
-
132
-
133
-
134
-
135
-
136
-
137
-
138
-
139
-
140
-
141
-
142
-
143
-
144
-
145
-
146
-
 147
147 -
 148
148 -
 149
149 -
 150
150 -
 151
151 -
 152
152 -
 153
153 -
 154
154 -
 155
155 -
 156
156 -
 157
157 -
 158
158 -
 159
159 -
 160
160 -
 161
161 -
 162
162 -
 163
163 -
 164
164 -
 165
165 -
 166
166 -
 167
167 -
168
-
169
-
170
-
171
-
172
-
173
-
174
-
175
-
176
-
177
-
178
-
179
-
180
-
181
-
182
-
183
-
184
-
185
-
186
-
187
-
188
-
189
-
190
-
191
-
192
-
193
-
194
-
195
-
196
-
197
-
198
-
199
-
200
-
201
-
202
-
203
-
204
-
205
-
206
-
207
-
208
-
209
-
210
-
211
-
212
-
213
-
214
-
215
-
216
-
217
-
218
-
219
-
220
-
221
-
222
-
223
-
224
-
225
-
226
-
227
-
228
-
229
-
230
-
231
-
232
-
233
-
234
-
235
-
236
-
237
-
238
-
239
-
240
-
241
-
242
-
243
-
244
-
245
-
246
-
247
-
248
-
249
-
250
-
251
-
252
-
253
-
254
-
255
-
256
-
257
-
258
-
259
-
260
-
261
-
262
-
263
-
264
-
265
-
266
-
267
-
268
 |
 |

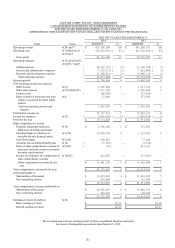
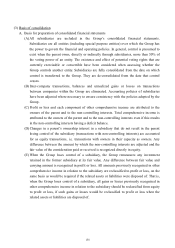
153
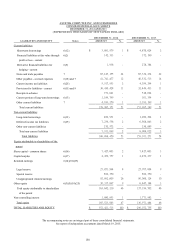
ASUSTEK COMPUTER INC. AND SUBSIDIARIES
CONSOLIDATED STATEMENTS OF CASH FLOWS
FOR THE YEARS ENDED DECEMBER 31, 2014 AND 2013
(EXPRESSED IN THOUSANDS OF NEW TAIWAN DOLLARS)
FOR THE YEARS ENDED DECEMBER 31,
2014 2013
The accompanying notes are an integral part of these consolidated financial statements.
See report of independent accountants dated March 19, 2015.
Cash flows from operating activities
Consolidated profit before income tax for the year
$
25,397,514
$
27,026,102
Adjustments to reconcile consolidated profit before income tax to net cash provided by
operating activities
Income and expenses that result in non-cash flows
Depreciation
2,725,264
2,578,962
Amortization
372,853
400,757
Bad debt provision (reversal of allowance for doubtful accounts)
260,707
(
192,157
)
Net loss (gain) on financial assets or liability at fair value through profit or loss
(
3,147,004
)
162,430
Share of profit of associates and joint ventures accounted for under equity method
(
22,486
)
(
571,969
)
Gain on disposal of investments
(
396,135
)
(
1,583,541
)
Impairment loss (reversal gain) on non-financial assets
(
24,426
)
200,598
Others
154,636
116,225
Changes in assets/liabilities relating to operating activities
Financial assets at fair value through profit or loss
9,313,927
966,175
Notes receivable
1,360,015
(
670,890
)
Trade receivables
(
7,072,838
)
(
8,218,552
)
Other receivables
(
2,715,867
)
(
1,804,522
)
Inventories
(
23,290,538
)
2,999,239
Prepayments
(
505,549
)
(
878,639
)
Other current assets
772,602
(
245,941
)
Financial liabilities at fair value through profit or loss
(
1,332,821
)
(
2,315,118
)
Notes and trade payables
19,812,921
1,945,755
Other payables - accrued expenses
2,205,511
10,303,503
Provision for liabilities
3,980,995
5,041,277
Receipts in advance
233,017
(
1,109,609
)
Other current liabilities
2,341,055
392,369
Other operating liabilities
6,782
(
1,115
)
Receipt of interest
655,179
623,855
Payment of interest
(
205,576
)
(
74,445
)
Payment of income tax
(
4,676,851
)
(
5,208,654
)
Net cash provided by (used in) operating activities
26,202,887
29,882,095
Cash flows from investing activities
Acquisition of available-for-sale financial assets
(
134,386
)
(
6,449
)
Proceeds from disposal of available-for-sale financial assets
596,647
175,250
Proceeds from disposal of investments accounted for under equity method
7,605
4,652,022
Acquisition of property, plant and equipment
(
1,389,990
)
(
2,328,017
)
Proceeds from disposal of property, plant and equipment
68,435
109,027
(Increase) decrease in refundable deposits
(
150,495
)
27,146
Acquisition of intangible assets
(
272,778
)
(
217,407
)
Changes in other non-current assets
(
1,032,140
)
(
1,193,058
)
Receipt of dividends
1,760,115
1,101,199
Others
(
18,312
)
(
9,893
)
Net cash provided by (used in) investing activities
(
565,299
)
2,309,820
Cash flows from financing activities
(Decrease) increase in short-term borrowings
(
1,119,842
)
1,068,500
Increase in long-term borrowings
302,809
928,525
Redemption of long-term borrowings
(
306,192
)
(
1,324,846
)
Payment of cash dividends
(
14,483,825
)
(
14,302,445
)
Purchase of treasury shares
-
(
2,525,987
)
Changes in non-controlling interest
(
138,476
)
(
106,485
)
Others
11,466
53,419
Net cash provided by (used in) financing activities
(
15,734,060
)
(
16,209,319
)
Effects due to changes in exchange rate
2,686,133
932,705
Increase in cash and cash equivalents
12,589,661
16,915,301
Cash and cash equivalents at beginning of the year
66,524,194
49,608,893
Cash and cash equivalents at end of the year
$
79,113,855
$
66,524,194