Asus 2014 Annual Report Download - page 109
Download and view the complete annual report
Please find page 109 of the 2014 Asus annual report below. You can navigate through the pages in the report by either clicking on the pages listed below, or by using the keyword search tool below to find specific information within the annual report.-
 1
1 -
2
-
3
-
4
-
5
-
6
-
7
-
8
-
9
-
10
-
11
-
12
-
13
-
14
-
15
-
16
-
17
-
18
-
19
-
20
-
21
-
22
-
23
-
24
-
25
-
26
-
27
-
28
-
29
-
30
-
31
-
32
-
33
-
34
-
35
-
36
-
37
-
38
-
39
-
40
-
41
-
42
-
43
-
44
-
45
-
46
-
47
-
48
-
49
-
50
-
51
-
52
-
53
-
54
-
55
-
56
-
57
-
58
-
59
-
60
-
61
-
62
-
63
-
64
-
65
-
66
-
67
-
68
-
69
-
70
-
71
-
72
-
73
-
74
-
75
-
76
-
77
-
78
-
79
-
80
-
81
-
82
-
83
-
84
-
85
-
86
-
87
-
88
-
89
-
90
-
91
-
92
-
93
-
94
-
95
-
96
-
97
-
98
-
 99
99 -
 100
100 -
 101
101 -
 102
102 -
 103
103 -
 104
104 -
 105
105 -
 106
106 -
 107
107 -
 108
108 -
 109
109 -
 110
110 -
 111
111 -
 112
112 -
 113
113 -
 114
114 -
 115
115 -
 116
116 -
 117
117 -
 118
118 -
 119
119 -
120
-
121
-
122
-
123
-
124
-
125
-
126
-
127
-
128
-
129
-
130
-
131
-
132
-
133
-
134
-
135
-
136
-
137
-
138
-
139
-
140
-
141
-
142
-
143
-
144
-
145
-
146
-
147
-
148
-
149
-
150
-
151
-
152
-
153
-
154
-
155
-
156
-
157
-
158
-
159
-
160
-
161
-
162
-
163
-
164
-
165
-
166
-
167
-
168
-
169
-
170
-
171
-
172
-
173
-
174
-
175
-
176
-
177
-
178
-
179
-
180
-
181
-
182
-
183
-
184
-
185
-
186
-
187
-
188
-
189
-
190
-
191
-
192
-
193
-
194
-
195
-
196
-
197
-
198
-
199
-
200
-
201
-
202
-
203
-
204
-
205
-
206
-
207
-
208
-
209
-
210
-
211
-
212
-
213
-
214
-
215
-
216
-
217
-
218
-
219
-
220
-
221
-
222
-
223
-
224
-
225
-
226
-
227
-
228
-
229
-
230
-
231
-
232
-
233
-
234
-
235
-
236
-
237
-
238
-
239
-
240
-
241
-
242
-
243
-
244
-
245
-
246
-
247
-
248
-
249
-
250
-
251
-
252
-
253
-
254
-
255
-
256
-
257
-
258
-
259
-
260
-
261
-
262
-
263
-
264
-
265
-
266
-
267
-
268
 |
 |
105
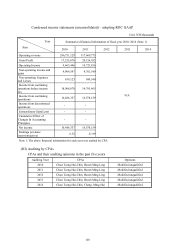
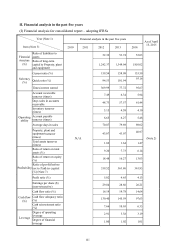
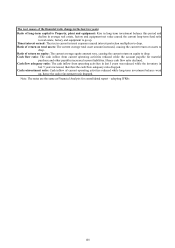
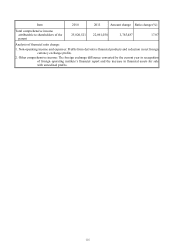
(2) Ratio of long-Term capital to fixed assets = (Net shareholders’ equity + Long-term liability) / Net
fixed assets
2. Solvency
(1) Current ratio = Current assets / current liability
(2) Quick ratio = (Current assets – Inventory – Prepaid expense) / Current liability
(3) Times interest earned = Net income before tax and interest expense / Interest expense of the year
3. Operating ability
(1) Account receivable turnover (including accounts receivable and notes receivable derived from
business operation) = Net sales / Average accounts receivable (including accounts receivable and
notes receivable derived from business operation)
(2) Days sales in accounts receivable = 365 / Account receivable turnover
(3) Inventory turnover = Cost of goods sold / Average inventory amount
(4) Account payable turnover (including accounts payable and notes payable derived from business
operation) = Cost of goods sold/ Average accounts payable (including accounts payable and notes
payable derived from business operation)
(5) Average days in sales = 365 / Inventory turnover
(6) Fixed assets turnover = Net sales / Net fixed assets
(7) Total assets turnover = Net sales / Total assets
4. Profitability
(1) Ratio of return on total assets = [Net income (loss) + interest expense x (1-tax rate)] / Average total
assets
(2) Ratio of return on shareholders’ equity = Net income (loss) / Net average shareholders’ equity
(3) Ratio to paid-in capital = Net income before tax / Paid-in capital
(4) Profit ratio = Net income (loss) / Net sales
(5) Earnings per share = (Net income – preferred stock dividend) / Weighted average stock shares issued
(Note4)
5. Cash flow
(1) Cash flow ratio = Net cash flow from operating activity / Current liabilities
(2) Cash flow adequacy ratio = Net cash flow from operating activity in the past five years / (Capital
expenditure + Inventory increase + Cash dividend) in the past five years
(3) Cash reinvestment ratio = (Net cash flow from operating activity – Cash dividend) / (Fixed assets +
Long-term investment + other assets + Working capital) (Note5)
6. Leverage:
(1) Degree of operating leverage = (Net operating revenue – Variable operating cost and expense) /
Operating income
(2) Degree of financial leverage = Operating income / (Operating income – interest expense)
Note 3: The following factors are to be included for consideration for the calculation of earnings per share:
1. It is based on the weighted average common stock shares instead of the outstanding stock shares at
yearend.
2. For capitalization with cash or Treasury stock trade, the stock circulation must be included for
consideration to calculate weighted average stock shares.
3. For capitalization with retained earnings and additional paid-in capital, the earnings per share calculated
semi-annually and annually must be adjusted retroactively and proportionally to the capitalization but
without considering the issuance period of the capitalization.
4. If preferred stock shares are nonconvertible and cumulative, the dividend of the year (whether it is
distributed or not) should be deducted from net income or added to the net loss. If preferred stock shares
are not cumulative, preferred stock dividend should be deducted from net income if there is any but it
needs not be added to net loss if there is any.
Note 4: The following factors are to be included for consideration for the analysis of cash flow:
1. Net cash flow from operating activity meant for the net cash inflow from operating activity on the