Asus 2014 Annual Report Download - page 190
Download and view the complete annual report
Please find page 190 of the 2014 Asus annual report below. You can navigate through the pages in the report by either clicking on the pages listed below, or by using the keyword search tool below to find specific information within the annual report.-
 1
1 -
2
-
3
-
4
-
5
-
6
-
7
-
8
-
9
-
10
-
11
-
12
-
13
-
14
-
15
-
16
-
17
-
18
-
19
-
20
-
21
-
22
-
23
-
24
-
25
-
26
-
27
-
28
-
29
-
30
-
31
-
32
-
33
-
34
-
35
-
36
-
37
-
38
-
39
-
40
-
41
-
42
-
43
-
44
-
45
-
46
-
47
-
48
-
49
-
50
-
51
-
52
-
53
-
54
-
55
-
56
-
57
-
58
-
59
-
60
-
61
-
62
-
63
-
64
-
65
-
66
-
67
-
68
-
69
-
70
-
71
-
72
-
73
-
74
-
75
-
76
-
77
-
78
-
79
-
80
-
81
-
82
-
83
-
84
-
85
-
86
-
87
-
88
-
89
-
90
-
91
-
92
-
93
-
94
-
95
-
96
-
97
-
98
-
99
-
100
-
101
-
102
-
103
-
104
-
105
-
106
-
107
-
108
-
109
-
110
-
111
-
112
-
113
-
114
-
115
-
116
-
117
-
118
-
119
-
120
-
121
-
122
-
123
-
124
-
125
-
126
-
127
-
128
-
129
-
130
-
131
-
132
-
133
-
134
-
135
-
136
-
137
-
138
-
139
-
140
-
141
-
142
-
143
-
144
-
145
-
146
-
147
-
148
-
149
-
150
-
151
-
152
-
153
-
154
-
155
-
156
-
157
-
158
-
159
-
160
-
161
-
162
-
163
-
164
-
165
-
166
-
167
-
168
-
169
-
170
-
171
-
172
-
173
-
174
-
175
-
176
-
177
-
178
-
179
-
 180
180 -
 181
181 -
 182
182 -
 183
183 -
 184
184 -
 185
185 -
 186
186 -
 187
187 -
 188
188 -
 189
189 -
 190
190 -
 191
191 -
 192
192 -
 193
193 -
 194
194 -
 195
195 -
 196
196 -
 197
197 -
 198
198 -
 199
199 -
 200
200 -
201
-
202
-
203
-
204
-
205
-
206
-
207
-
208
-
209
-
210
-
211
-
212
-
213
-
214
-
215
-
216
-
217
-
218
-
219
-
220
-
221
-
222
-
223
-
224
-
225
-
226
-
227
-
228
-
229
-
230
-
231
-
232
-
233
-
234
-
235
-
236
-
237
-
238
-
239
-
240
-
241
-
242
-
243
-
244
-
245
-
246
-
247
-
248
-
249
-
250
-
251
-
252
-
253
-
254
-
255
-
256
-
257
-
258
-
259
-
260
-
261
-
262
-
263
-
264
-
265
-
266
-
267
-
268
 |
 |

186
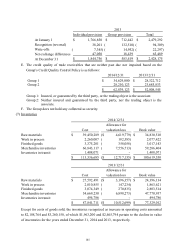
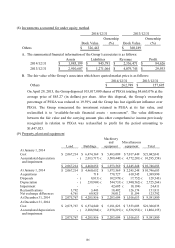
(8) Investments accounted for under equity method
A. The summarized financial information of the Group’s associates is as follows:
B. The fair value of the Group’s associates which have quoted market price is as follows:
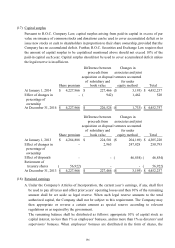
On April 29, 2013, the Group disposed 103,017,000 shares of PEGA totaling $4,663,076 at the
average price of $45.27 (in dollars) per share. After this disposal, the Group’s ownership
percentage of PEGA was reduced to 19.59% and the Group has lost significant influence over
PEGA. The Group remeasured the investment retained in PEGA at its fair value, and
reclassified it to “available-for-sale financial assets - non-current”. The value difference
between the fair value and the carrying amount plus other comprehensive income previously
recognized in relation to PEGA was reclassified to profit for the period amounting to
$1,447,023.
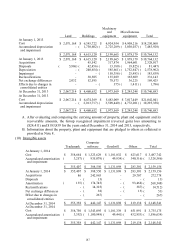
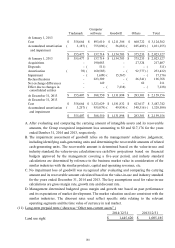
(9) Property, plant and equipment
Ownership Ownership
Book Value (%) Book Value (%)
Others 326,443$ 360,189$
2014/12/31
2013/12/31
Assets Liabilities Revenue Profit
2014/12/31 1,885,199$ 945,791$ 2,336,471$ 84,626$
2013/12/31 2,910,607$ 1,271,064$ 4,079,745$ 29,933$
0
2014/12/31 2013/12/31
Others 262,789$ 157,695$
Machinery
and Miscellaneous
Land Buildings equipment equipment Total
At January 1, 2014
Cost 2,067,214$ 6,474,369$ 5,483,009$ 7,017,449$ 21,042,041$
Accumulated depreciation - 2,013,717)( 3,509,440)( 4,772,201)( 10,295,358)(
and impairment
2,067,214$ 4,460,652$ 1,973,569$ 2,245,248$ 10,746,683$
At January 1, 2014 2,067,214$ 4,460,652$ 1,973,569$ 2,245,248$ 10,746,683$
Acquisitions - 718 778,727 610,545 1,389,990
Disposals - 8,813)( 102,978)( 17,752)( 129,543)(
Depreciation - 239,969)( 544,733)( 1,940,562)( 2,725,264)(
Impairment - - 42,605 18,194)( 24,411
Reclassifications 3,792 3,443 18,402 126,174 151,811
Net exchange differences 4,761 69,825 38,012 11,194 123,792
At December 31, 2014 2,075,767$ 4,285,856$ 2,203,604$ 1,016,653$ 9,581,880$
At December 31, 2014
Cost 2,075,767$ 6,574,840$ 5,181,823$ 7,553,605$ 21,386,035$
Accumulated depreciation - 2,288,984)( 2,978,219)( 6,536,952)( 11,804,155)(
and impairment
2,075,767$ 4,285,856$ 2,203,604$ 1,016,653$ 9,581,880$