Asus 2014 Annual Report Download - page 227
Download and view the complete annual report
Please find page 227 of the 2014 Asus annual report below. You can navigate through the pages in the report by either clicking on the pages listed below, or by using the keyword search tool below to find specific information within the annual report.-
 1
1 -
2
-
3
-
4
-
5
-
6
-
7
-
8
-
9
-
10
-
11
-
12
-
13
-
14
-
15
-
16
-
17
-
18
-
19
-
20
-
21
-
22
-
23
-
24
-
25
-
26
-
27
-
28
-
29
-
30
-
31
-
32
-
33
-
34
-
35
-
36
-
37
-
38
-
39
-
40
-
41
-
42
-
43
-
44
-
45
-
46
-
47
-
48
-
49
-
50
-
51
-
52
-
53
-
54
-
55
-
56
-
57
-
58
-
59
-
60
-
61
-
62
-
63
-
64
-
65
-
66
-
67
-
68
-
69
-
70
-
71
-
72
-
73
-
74
-
75
-
76
-
77
-
78
-
79
-
80
-
81
-
82
-
83
-
84
-
85
-
86
-
87
-
88
-
89
-
90
-
91
-
92
-
93
-
94
-
95
-
96
-
97
-
98
-
99
-
100
-
101
-
102
-
103
-
104
-
105
-
106
-
107
-
108
-
109
-
110
-
111
-
112
-
113
-
114
-
115
-
116
-
117
-
118
-
119
-
120
-
121
-
122
-
123
-
124
-
125
-
126
-
127
-
128
-
129
-
130
-
131
-
132
-
133
-
134
-
135
-
136
-
137
-
138
-
139
-
140
-
141
-
142
-
143
-
144
-
145
-
146
-
147
-
148
-
149
-
150
-
151
-
152
-
153
-
154
-
155
-
156
-
157
-
158
-
159
-
160
-
161
-
162
-
163
-
164
-
165
-
166
-
167
-
168
-
169
-
170
-
171
-
172
-
173
-
174
-
175
-
176
-
177
-
178
-
179
-
180
-
181
-
182
-
183
-
184
-
185
-
186
-
187
-
188
-
189
-
190
-
191
-
192
-
193
-
194
-
195
-
196
-
197
-
198
-
199
-
200
-
201
-
202
-
203
-
204
-
205
-
206
-
207
-
208
-
209
-
210
-
211
-
212
-
213
-
214
-
215
-
216
-
 217
217 -
 218
218 -
 219
219 -
 220
220 -
 221
221 -
 222
222 -
 223
223 -
 224
224 -
 225
225 -
 226
226 -
 227
227 -
 228
228 -
 229
229 -
 230
230 -
 231
231 -
 232
232 -
 233
233 -
 234
234 -
 235
235 -
 236
236 -
 237
237 -
238
-
239
-
240
-
241
-
242
-
243
-
244
-
245
-
246
-
247
-
248
-
249
-
250
-
251
-
252
-
253
-
254
-
255
-
256
-
257
-
258
-
259
-
260
-
261
-
262
-
263
-
264
-
265
-
266
-
267
-
268
 |
 |

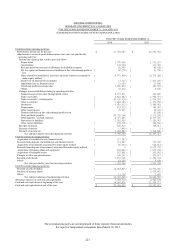
223
ASUSTEK COMPUTER INC.
SEPARATE STATEMENTS OF CASH FLOWS
FOR THE YEARS ENDED DECEMBER 31, 2014 AND 2013
(EXPRESSED IN THOUSANDS OF NEW TAIWAN DOLLARS)
FOR THE YEARS ENDED DECEMBER 31,
2014
2013
The accompanying notes are an integral part of these separate financial statements.
See report of independent accountants dated March 19, 2015.
Cash flows from operating activities
Profit before income tax for the year
$
23,376,083
$
25,561,762
Adjustments to reconcile profit before income tax to net cash provided by
operating activities
Income and expenses that result in non-cash flows
Depreciation
1,776,698
1,532,321
Amortization
134,924
133,303
Bad debt provision (reversal of allowance for doubtful accounts)
89,955
(
86,428
)
Net loss (gain) on financial assets or liabilities at fair value through profit or
loss
(
40,276
)
(
43,790
)
Share of profit of subsidiaries, associates and joint ventures accounted for
under equity method
(
8,751,499
)
(
10,775,288
)
(Gain) loss on disposal of investments
(
13,727
)
(
1,470,225
)
Impairment loss on financial assets
21,160
23,666
Unrealized profit (loss) from sales
1,049,817
(
249,992
)
Others
16,222
8,629
Changes in assets/liabilities relating to operating activities
Financial assets at fair value through profit or loss
4,157,431
224,899
Trade receivables
(
2,601,687
)
(
1,596,971
)
Trade receivables - related parties
(
20,939,524
)
1,574,355
Other receivables
(
1,884,383
)
(
1,279,762
)
Inventories
(
9,801,012
)
2,586,581
Prepayments
(
653,223
)
(
140,287
)
Other current assets
25,427
(
38,223
)
Financial liabilities at fair value through profit or loss
-
(
10,050
)
Notes and trade payables
20,759,348
(
3,371,265
)
Other payables - accrued expenses
4,377,023
6,117,725
Provisions for liabilities
1,052,902
1,229,787
Other current liabilities
(
270,526
)
(
164,638
)
Receipts of interest
202,519
198,013
Payment of interest
(
13,409
)
(
5
)
Payment of income tax
(
2,284,883
)
(
3,596,806
)
Net cash provided by (used in) operating activities
9,785,360
16,367,311
Cash flows from investing activities
Acquisition of available-for-sale financial assets
(
127,262
)
-
Proceeds from disposal of available-for-sale financial assets
114,427
175,250
Acquisition of investments accounted for under equity method
(
85,290
)
(
924,814
)
Proceeds from disposal of investments accounted for under equity method
9
4,625,770
Acquisition of property, plant and equipment
(
458,883
)
(
1,815,704
)
Acquisition of intangible assets
(
167,801
)
(
139,003
)
Changes in other non-current assets
(
106,797
)
(
179,917
)
Receipts of dividends
2,153,336
1,259,194
Others
61,255
(
5,418
)
Net cash provided by (used in) investing activities
1,382,994
2,995,358
Cash flows from financing activities
Payment of cash dividends
(
14,483,825
)
(
14,302,445
)
Purchase of treasury shares
-
(
2,525,987
)
Others
11,159
7,867
Net cash provided (used in) financing activities
(
14,472,666
)
(
16,820,565
)
(Decrease) increase in cash and cash equivalents
(
3,304,312
)
2,542,104
Cash and cash equivalents at beginning of the year
24,262,821
21,720,717
Cash and cash equivalents at end of the year
$
20,958,509
$
24,262,821