Asus 2014 Annual Report Download - page 219
Download and view the complete annual report
Please find page 219 of the 2014 Asus annual report below. You can navigate through the pages in the report by either clicking on the pages listed below, or by using the keyword search tool below to find specific information within the annual report.-
 1
1 -
2
-
3
-
4
-
5
-
6
-
7
-
8
-
9
-
10
-
11
-
12
-
13
-
14
-
15
-
16
-
17
-
18
-
19
-
20
-
21
-
22
-
23
-
24
-
25
-
26
-
27
-
28
-
29
-
30
-
31
-
32
-
33
-
34
-
35
-
36
-
37
-
38
-
39
-
40
-
41
-
42
-
43
-
44
-
45
-
46
-
47
-
48
-
49
-
50
-
51
-
52
-
53
-
54
-
55
-
56
-
57
-
58
-
59
-
60
-
61
-
62
-
63
-
64
-
65
-
66
-
67
-
68
-
69
-
70
-
71
-
72
-
73
-
74
-
75
-
76
-
77
-
78
-
79
-
80
-
81
-
82
-
83
-
84
-
85
-
86
-
87
-
88
-
89
-
90
-
91
-
92
-
93
-
94
-
95
-
96
-
97
-
98
-
99
-
100
-
101
-
102
-
103
-
104
-
105
-
106
-
107
-
108
-
109
-
110
-
111
-
112
-
113
-
114
-
115
-
116
-
117
-
118
-
119
-
120
-
121
-
122
-
123
-
124
-
125
-
126
-
127
-
128
-
129
-
130
-
131
-
132
-
133
-
134
-
135
-
136
-
137
-
138
-
139
-
140
-
141
-
142
-
143
-
144
-
145
-
146
-
147
-
148
-
149
-
150
-
151
-
152
-
153
-
154
-
155
-
156
-
157
-
158
-
159
-
160
-
161
-
162
-
163
-
164
-
165
-
166
-
167
-
168
-
169
-
170
-
171
-
172
-
173
-
174
-
175
-
176
-
177
-
178
-
179
-
180
-
181
-
182
-
183
-
184
-
185
-
186
-
187
-
188
-
189
-
190
-
191
-
192
-
193
-
194
-
195
-
196
-
197
-
198
-
199
-
200
-
201
-
202
-
203
-
204
-
205
-
206
-
207
-
208
-
 209
209 -
 210
210 -
 211
211 -
 212
212 -
 213
213 -
 214
214 -
 215
215 -
 216
216 -
 217
217 -
 218
218 -
 219
219 -
 220
220 -
 221
221 -
 222
222 -
 223
223 -
 224
224 -
 225
225 -
 226
226 -
 227
227 -
 228
228 -
 229
229 -
230
-
231
-
232
-
233
-
234
-
235
-
236
-
237
-
238
-
239
-
240
-
241
-
242
-
243
-
244
-
245
-
246
-
247
-
248
-
249
-
250
-
251
-
252
-
253
-
254
-
255
-
256
-
257
-
258
-
259
-
260
-
261
-
262
-
263
-
264
-
265
-
266
-
267
-
268
 |
 |

215
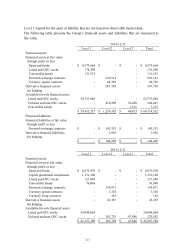
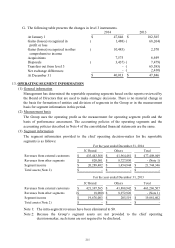
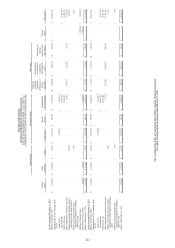
G. The following table presents the changes in level 3 instruments.
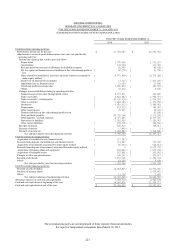
13. OPERATING SEGMENT INFORMATION
(1) General information
Management has determined the reportable operating segments based on the reports reviewed by
the Board of Directors that are used to make strategic decisions. There is no material change in
the basis for formation of entities and division of segments in the Group or in the measurement
basis for segment information in this period.
(2) Measurement basis
The Group uses the operating profit as the measurement for operating segment profit and the
basis of performance assessment. The accounting policies of the operating segments and the
accounting policies described in Note 4 of the consolidated financial statements are the same.
(3) Segment information
The segment information provided to the chief operating decision-maker for the reportable
segments is as follows:
Note 1:
The intra-segment revenues have been eliminated to $0.
Note 2:
Because the Group’s segment assets are not provided to the chief operating
decision-maker, such items are not required to be disclosed.
2014 2013
At January 1 47,846$ 182,565$
Gains (losses) recognized in 1,488)( 68,264)(
profit or loss
Gains (losses) recognized in other 10,483)( 2,570
comprehensive income
Acquisitions 7,575 6,449
Disposals 3,437)( 7,479)(
Transfers out from level 3 - 65,585)(
Net exchange differences - 2,410)(
At December 31 40,013$ 47,846$
3C Brand Others Total
Revenues from external customers 435,443,568$ 41,964,481$ 477,408,049$
Revenues from other segments 820,081$ 8,727,050$ - (Note 1)
Segment income 20,289,402$ 1,454,944$ 21,744,346$
Total assets (Note 2) -$ -$ -$
For the year ended December 31, 2014
3C Brand Others Total
Revenues from external customers 421,397,565$ 41,888,942$ 463,286,507$
Revenues from other segments 18,000)($ 8,972,926$ - (Note 1)
Segment income 19,676,083$ 205,519$ 19,881,602$
Total assets (Note 2) -$ -$ -$
For the year ended December 31, 2013