Asus 2014 Annual Report Download - page 217
Download and view the complete annual report
Please find page 217 of the 2014 Asus annual report below. You can navigate through the pages in the report by either clicking on the pages listed below, or by using the keyword search tool below to find specific information within the annual report.-
 1
1 -
2
-
3
-
4
-
5
-
6
-
7
-
8
-
9
-
10
-
11
-
12
-
13
-
14
-
15
-
16
-
17
-
18
-
19
-
20
-
21
-
22
-
23
-
24
-
25
-
26
-
27
-
28
-
29
-
30
-
31
-
32
-
33
-
34
-
35
-
36
-
37
-
38
-
39
-
40
-
41
-
42
-
43
-
44
-
45
-
46
-
47
-
48
-
49
-
50
-
51
-
52
-
53
-
54
-
55
-
56
-
57
-
58
-
59
-
60
-
61
-
62
-
63
-
64
-
65
-
66
-
67
-
68
-
69
-
70
-
71
-
72
-
73
-
74
-
75
-
76
-
77
-
78
-
79
-
80
-
81
-
82
-
83
-
84
-
85
-
86
-
87
-
88
-
89
-
90
-
91
-
92
-
93
-
94
-
95
-
96
-
97
-
98
-
99
-
100
-
101
-
102
-
103
-
104
-
105
-
106
-
107
-
108
-
109
-
110
-
111
-
112
-
113
-
114
-
115
-
116
-
117
-
118
-
119
-
120
-
121
-
122
-
123
-
124
-
125
-
126
-
127
-
128
-
129
-
130
-
131
-
132
-
133
-
134
-
135
-
136
-
137
-
138
-
139
-
140
-
141
-
142
-
143
-
144
-
145
-
146
-
147
-
148
-
149
-
150
-
151
-
152
-
153
-
154
-
155
-
156
-
157
-
158
-
159
-
160
-
161
-
162
-
163
-
164
-
165
-
166
-
167
-
168
-
169
-
170
-
171
-
172
-
173
-
174
-
175
-
176
-
177
-
178
-
179
-
180
-
181
-
182
-
183
-
184
-
185
-
186
-
187
-
188
-
189
-
190
-
191
-
192
-
193
-
194
-
195
-
196
-
197
-
198
-
199
-
200
-
201
-
202
-
203
-
204
-
205
-
206
-
 207
207 -
 208
208 -
 209
209 -
 210
210 -
 211
211 -
 212
212 -
 213
213 -
 214
214 -
 215
215 -
 216
216 -
 217
217 -
 218
218 -
 219
219 -
 220
220 -
 221
221 -
 222
222 -
 223
223 -
 224
224 -
 225
225 -
 226
226 -
 227
227 -
228
-
229
-
230
-
231
-
232
-
233
-
234
-
235
-
236
-
237
-
238
-
239
-
240
-
241
-
242
-
243
-
244
-
245
-
246
-
247
-
248
-
249
-
250
-
251
-
252
-
253
-
254
-
255
-
256
-
257
-
258
-
259
-
260
-
261
-
262
-
263
-
264
-
265
-
266
-
267
-
268
 |
 |

213
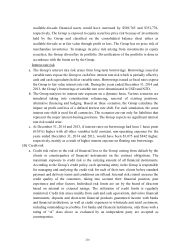
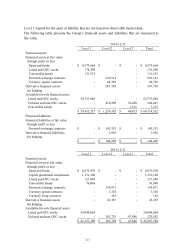
Level 3: Inputs for the asset or liability that are not based on observable market data.
The following table presents the Group’s financial assets and liabilities that are measured at
fair value.
Level 1 Level 2 Level 3 Total
Financial assets:
Financial assets at fair value
through profit or loss
Open-end funds 4,373,664$ -$ -$ 4,373,664$
Listed and OTC stocks 176,298 - - 176,298
Convertible bonds 131,535 - - 131,535
Forward exchange contracts - 636,512 - 636,512
Currency option contracts - 44,703 - 44,703
Derivative financial assets - 367,758 - 367,758
for hedging
Available-for-sale financial assets
Listed and OTC stocks 54,733,840 - - 54,733,840
Unlisted and non-OTC stocks - 210,209 32,438 242,647
Convertible bonds - - 7,575 7,575
59,415,337$ 1,259,182$ 40,013$ 60,714,532$
Financial liabilities:
Financial liabilities at fair value
through profit or loss
Forward exchange contracts -$ 142,333$ -$ 142,333$
Derivative financial liabilities - 1,936 - 1,936
for hedging
-$ 144,269$ -$ 144,269$
2014/12/31
Level 1 Level 2 Level 3 Total
Financial assets:
Financial assets at fair value
through profit or loss
Open-end funds 8,873,970$ -$ -$ 8,873,970$
Capital guaranteed instruments 1,131,100 - - 1,131,100
Listed and OTC stocks 127,988 - - 127,988
Convertible bonds 76,068 - - 76,068
Forward exchange contracts - 134,071 - 134,071
Currency option contracts - 3,326 - 3,326
Currency swap contracts - 185 - 185
Derivative financial assets - 43,387 - 43,387
for hedging
Available-for-sale financial assets
Listed and OTC stocks 34,948,064 - - 34,948,064
Unlisted and non-OTC stocks - 181,735 47,846 229,581
45,157,190$ 362,704$ 47,846$ 45,567,740$
2013/12/31