Asus 2014 Annual Report Download - page 155
Download and view the complete annual report
Please find page 155 of the 2014 Asus annual report below. You can navigate through the pages in the report by either clicking on the pages listed below, or by using the keyword search tool below to find specific information within the annual report.-
 1
1 -
2
-
3
-
4
-
5
-
6
-
7
-
8
-
9
-
10
-
11
-
12
-
13
-
14
-
15
-
16
-
17
-
18
-
19
-
20
-
21
-
22
-
23
-
24
-
25
-
26
-
27
-
28
-
29
-
30
-
31
-
32
-
33
-
34
-
35
-
36
-
37
-
38
-
39
-
40
-
41
-
42
-
43
-
44
-
45
-
46
-
47
-
48
-
49
-
50
-
51
-
52
-
53
-
54
-
55
-
56
-
57
-
58
-
59
-
60
-
61
-
62
-
63
-
64
-
65
-
66
-
67
-
68
-
69
-
70
-
71
-
72
-
73
-
74
-
75
-
76
-
77
-
78
-
79
-
80
-
81
-
82
-
83
-
84
-
85
-
86
-
87
-
88
-
89
-
90
-
91
-
92
-
93
-
94
-
95
-
96
-
97
-
98
-
99
-
100
-
101
-
102
-
103
-
104
-
105
-
106
-
107
-
108
-
109
-
110
-
111
-
112
-
113
-
114
-
115
-
116
-
117
-
118
-
119
-
120
-
121
-
122
-
123
-
124
-
125
-
126
-
127
-
128
-
129
-
130
-
131
-
132
-
133
-
134
-
135
-
136
-
137
-
138
-
139
-
140
-
141
-
142
-
143
-
144
-
 145
145 -
 146
146 -
 147
147 -
 148
148 -
 149
149 -
 150
150 -
 151
151 -
 152
152 -
 153
153 -
 154
154 -
 155
155 -
 156
156 -
 157
157 -
 158
158 -
 159
159 -
 160
160 -
 161
161 -
 162
162 -
 163
163 -
 164
164 -
 165
165 -
166
-
167
-
168
-
169
-
170
-
171
-
172
-
173
-
174
-
175
-
176
-
177
-
178
-
179
-
180
-
181
-
182
-
183
-
184
-
185
-
186
-
187
-
188
-
189
-
190
-
191
-
192
-
193
-
194
-
195
-
196
-
197
-
198
-
199
-
200
-
201
-
202
-
203
-
204
-
205
-
206
-
207
-
208
-
209
-
210
-
211
-
212
-
213
-
214
-
215
-
216
-
217
-
218
-
219
-
220
-
221
-
222
-
223
-
224
-
225
-
226
-
227
-
228
-
229
-
230
-
231
-
232
-
233
-
234
-
235
-
236
-
237
-
238
-
239
-
240
-
241
-
242
-
243
-
244
-
245
-
246
-
247
-
248
-
249
-
250
-
251
-
252
-
253
-
254
-
255
-
256
-
257
-
258
-
259
-
260
-
261
-
262
-
263
-
264
-
265
-
266
-
267
-
268
 |
 |

151
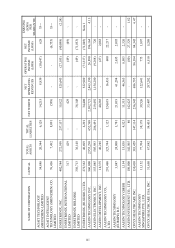
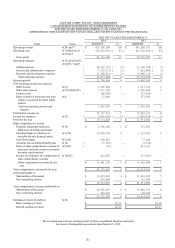
ASUSTEK COMPUTER INC. AND SUBSIDIARIES
CONSOLIDATED STATEMENTS OF COMPREHENSIVE INCOME
FOR THE YEARS ENDED DECEMBER 31, 2014 AND 2013
(EXPRESSED IN THOUSANDS OF NEW TAIWAN DOLLARS, EXCEPT EARNINGS PER SHARE DATA)
The accompanying notes are an integral part of these consolidated financial statements.
See report of independent accountants dated March 19, 2015.
FOR THE YEARS ENDED DECEMBER 31,
2014
2013
Items
Notes
AMOUNT
%
AMOUNT
%
Operating revenue
6(20) and 7
$
477,408,049
100
$
463,286,507
100
Operating costs
6(7)(14)(18)(23)
(24) and 7
(
412,024,261
)
(
87
)
(
403,316,442
)
(
87
)
Gross profit
65,383,788
13
59,970,065
13
Operating expenses
6(11)(14)(18)(23)
(24)(27), 7 and 9
Selling expenses
(
24,602,102
)
(
5
)
(
21,906,256
)
(
5
)
General and administrative expenses
(
7,703,711
)
(
2
)
(
7,261,486
)
(
2
)
Research and development expenses
(
11,368,011
)
(
2
)
(
10,966,313
)
(
2
)
Total operating expenses
(
43,673,824
)
(
9
)
(
40,134,055
)
(
9
)
Operating profit
21,709,964
4
19,836,010
4
Non-operating income and expenses
Other income
6(21)
2,405,409
1
1,713,743
1
Other gains (losses)
6(2)(3)(8)(9)(22)
1,527,920
-
5,256,646
1
Finance costs
(
268,265
)
-
(
352,266
)
-
Share of profit of associates and joint
ventures accounted for under equity
method
6(8)
22,486
-
571,969
-
Total non-operating income and
expenses
3,687,550
1
7,190,092
2
Profit before income tax
25,397,514
5
27,026,102
6
Income tax expenses
6(25)
(
5,683,109
)
(
1
)
(
5,494,438
)
(
1
)
Profit for the year
$
19,714,405
4
$
21,531,664
5
Other comprehensive income
Financial statements translation
differences of foreign operations
6(19)
$
2,560,043
1
$
797,850
-
Unrealized gain on valuation of
available-for-sale financial assets
6(3)(19)
19,890,799
4
3,193,282
1
Cash flow hedges
6(5)(19)
600,819
-
57,044
-
Actuarial loss on defined benefit plan
6(14)
(
15,052
)
-
(
6,770
)
-
Share of other comprehensive income of
associates and joint ventures accounted
for under equity method
6(8)(19)
(
187
)
-
617,033
-
Income tax relating to the components of
other comprehensive income
6(19)(25)
424,678
-
(
275,490
)
-
Other comprehensive income for the
year
$
23,461,100
5
$
4,382,949
1
Total comprehensive income for the year
$
43,175,505
9
$
25,914,613
6
Profit attributable to:
Shareholders of the parent
$
19,470,409
4
$
21,449,895
5
Non-controlling interest
243,996
-
81,769
-
$
19,714,405
4
$
21,531,664
5
Total comprehensive income attributable to:
Shareholders of the parent
$
42,926,013
9
$
25,826,521
6
Non-controlling interest
249,492
-
88,092
-
$
43,175,505
9
$
25,914,613
6
Earnings per share (In dollars)
6(26)
Basic earnings per share
$
26.21
$
28.66
Diluted earnings per share
$
26.07
$
28.47