Asus 2014 Annual Report Download - page 218
Download and view the complete annual report
Please find page 218 of the 2014 Asus annual report below. You can navigate through the pages in the report by either clicking on the pages listed below, or by using the keyword search tool below to find specific information within the annual report.-
 1
1 -
2
-
3
-
4
-
5
-
6
-
7
-
8
-
9
-
10
-
11
-
12
-
13
-
14
-
15
-
16
-
17
-
18
-
19
-
20
-
21
-
22
-
23
-
24
-
25
-
26
-
27
-
28
-
29
-
30
-
31
-
32
-
33
-
34
-
35
-
36
-
37
-
38
-
39
-
40
-
41
-
42
-
43
-
44
-
45
-
46
-
47
-
48
-
49
-
50
-
51
-
52
-
53
-
54
-
55
-
56
-
57
-
58
-
59
-
60
-
61
-
62
-
63
-
64
-
65
-
66
-
67
-
68
-
69
-
70
-
71
-
72
-
73
-
74
-
75
-
76
-
77
-
78
-
79
-
80
-
81
-
82
-
83
-
84
-
85
-
86
-
87
-
88
-
89
-
90
-
91
-
92
-
93
-
94
-
95
-
96
-
97
-
98
-
99
-
100
-
101
-
102
-
103
-
104
-
105
-
106
-
107
-
108
-
109
-
110
-
111
-
112
-
113
-
114
-
115
-
116
-
117
-
118
-
119
-
120
-
121
-
122
-
123
-
124
-
125
-
126
-
127
-
128
-
129
-
130
-
131
-
132
-
133
-
134
-
135
-
136
-
137
-
138
-
139
-
140
-
141
-
142
-
143
-
144
-
145
-
146
-
147
-
148
-
149
-
150
-
151
-
152
-
153
-
154
-
155
-
156
-
157
-
158
-
159
-
160
-
161
-
162
-
163
-
164
-
165
-
166
-
167
-
168
-
169
-
170
-
171
-
172
-
173
-
174
-
175
-
176
-
177
-
178
-
179
-
180
-
181
-
182
-
183
-
184
-
185
-
186
-
187
-
188
-
189
-
190
-
191
-
192
-
193
-
194
-
195
-
196
-
197
-
198
-
199
-
200
-
201
-
202
-
203
-
204
-
205
-
206
-
207
-
 208
208 -
 209
209 -
 210
210 -
 211
211 -
 212
212 -
 213
213 -
 214
214 -
 215
215 -
 216
216 -
 217
217 -
 218
218 -
 219
219 -
 220
220 -
 221
221 -
 222
222 -
 223
223 -
 224
224 -
 225
225 -
 226
226 -
 227
227 -
 228
228 -
229
-
230
-
231
-
232
-
233
-
234
-
235
-
236
-
237
-
238
-
239
-
240
-
241
-
242
-
243
-
244
-
245
-
246
-
247
-
248
-
249
-
250
-
251
-
252
-
253
-
254
-
255
-
256
-
257
-
258
-
259
-
260
-
261
-
262
-
263
-
264
-
265
-
266
-
267
-
268
 |
 |

214
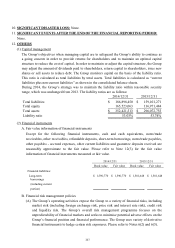
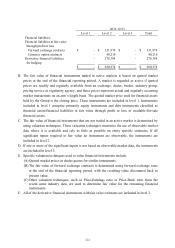
B. The fair value of financial instruments traded in active markets is based on quoted market
prices at the end of the financial reporting period. A market is regarded as active if quoted
prices are readily and regularly available from an exchange, dealer, broker, industry group,
pricing service or regulatory agency, and those prices represent actual and regularly occurring
market transactions on an arm’s length basis. The quoted market price used for financial assets
held by the Group is the closing price. These instruments are included in level 1. Instruments
included in level 1 comprise primarily equity instruments and debt instruments classified as
financial assets/financial liabilities at fair value through profit or loss or available-for-sale
financial assets.
C. The fair value of financial instruments that are not traded in an active market is determined by
using valuation techniques. These valuation techniques maximise the use of observable market
data where it is available and rely as little as possible on entity specific estimates. If all
significant inputs required to fair value an instrument are observable, the instruments are
included in level 2.
D. If one or more of the significant inputs is not based on observable market data, the instruments
are included in level 3.
E. Specific valuation techniques used to value financial instruments include:
(A) Quoted market prices or dealer quotes for similar instruments.
(B) The fair value of forward exchange contracts is determined using forward exchange rates
at the end of the financial reporting period, with the resulting value discounted back to
present value.
(C) Other valuation techniques, such as Price-Earnings ratio or Price-Book ratio from the
recent same industry data, are used to determine fair value for the remaining financial
instruments.
F. All of the derivative financial instruments with fair value estimates are included in level 2.
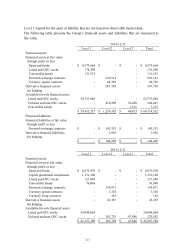
Level 1 Level 2 Level 3 Total
Financial liabilities:
Financial liabilities at fair value
through profit or loss
Forward exchange contracts -$ 331,974$ -$ 331,974$
Currency option contracts - 40,216 - 40,216
Derivative financial liabilities - 278,384 - 278,384
for hedging
-$ 650,574$ -$ 650,574$
2013/12/31