Asus 2014 Annual Report Download - page 191
Download and view the complete annual report
Please find page 191 of the 2014 Asus annual report below. You can navigate through the pages in the report by either clicking on the pages listed below, or by using the keyword search tool below to find specific information within the annual report.-
 1
1 -
2
-
3
-
4
-
5
-
6
-
7
-
8
-
9
-
10
-
11
-
12
-
13
-
14
-
15
-
16
-
17
-
18
-
19
-
20
-
21
-
22
-
23
-
24
-
25
-
26
-
27
-
28
-
29
-
30
-
31
-
32
-
33
-
34
-
35
-
36
-
37
-
38
-
39
-
40
-
41
-
42
-
43
-
44
-
45
-
46
-
47
-
48
-
49
-
50
-
51
-
52
-
53
-
54
-
55
-
56
-
57
-
58
-
59
-
60
-
61
-
62
-
63
-
64
-
65
-
66
-
67
-
68
-
69
-
70
-
71
-
72
-
73
-
74
-
75
-
76
-
77
-
78
-
79
-
80
-
81
-
82
-
83
-
84
-
85
-
86
-
87
-
88
-
89
-
90
-
91
-
92
-
93
-
94
-
95
-
96
-
97
-
98
-
99
-
100
-
101
-
102
-
103
-
104
-
105
-
106
-
107
-
108
-
109
-
110
-
111
-
112
-
113
-
114
-
115
-
116
-
117
-
118
-
119
-
120
-
121
-
122
-
123
-
124
-
125
-
126
-
127
-
128
-
129
-
130
-
131
-
132
-
133
-
134
-
135
-
136
-
137
-
138
-
139
-
140
-
141
-
142
-
143
-
144
-
145
-
146
-
147
-
148
-
149
-
150
-
151
-
152
-
153
-
154
-
155
-
156
-
157
-
158
-
159
-
160
-
161
-
162
-
163
-
164
-
165
-
166
-
167
-
168
-
169
-
170
-
171
-
172
-
173
-
174
-
175
-
176
-
177
-
178
-
179
-
180
-
 181
181 -
 182
182 -
 183
183 -
 184
184 -
 185
185 -
 186
186 -
 187
187 -
 188
188 -
 189
189 -
 190
190 -
 191
191 -
 192
192 -
 193
193 -
 194
194 -
 195
195 -
 196
196 -
 197
197 -
 198
198 -
 199
199 -
 200
200 -
 201
201 -
202
-
203
-
204
-
205
-
206
-
207
-
208
-
209
-
210
-
211
-
212
-
213
-
214
-
215
-
216
-
217
-
218
-
219
-
220
-
221
-
222
-
223
-
224
-
225
-
226
-
227
-
228
-
229
-
230
-
231
-
232
-
233
-
234
-
235
-
236
-
237
-
238
-
239
-
240
-
241
-
242
-
243
-
244
-
245
-
246
-
247
-
248
-
249
-
250
-
251
-
252
-
253
-
254
-
255
-
256
-
257
-
258
-
259
-
260
-
261
-
262
-
263
-
264
-
265
-
266
-
267
-
268
 |
 |

187
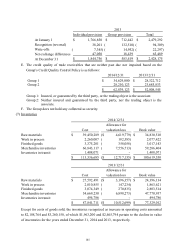
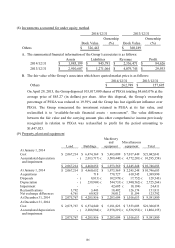
A. After evaluating and comparing the carrying amount of property, plant and equipment and its
recoverable amounts, the Group recognized impairment (reversal gain) loss amounting to
($24,411) and $183,839 for the years ended December 31, 2014 and 2013, respectively.
B. Information about the property, plant and equipment that are pledged to others as collateral is
provided in Note 8.
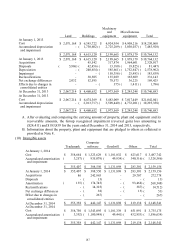
(10) Intangible assets
Machinery
and Miscellaneous
Land Buildings equipment equipment Total
At January 1, 2013
Cost 2,071,168$ 6,345,722$ 4,924,954$ 4,908,216$ 18,250,060$
Accumulated depreciation - 1,730,602)( 2,725,289)( 3,030,037)( 7,485,928)(
and impairment
2,071,168$ 4,615,120$ 2,199,665$ 1,878,179$ 10,764,132$
At January 1, 2013 2,071,168$ 4,615,120$ 2,199,665$ 1,878,179$ 10,764,132$
Acquisitions - 45,542 317,874 1,964,601 2,328,017
Disposals 5,986)( 42,456)( 13,180)( 19,825)( 81,447)(
Depreciation - 240,654)( 585,661)( 1,752,647)( 2,578,962)(
Impairment - - 158,356)( 25,483)( 183,839)(
Reclassifications - 30,505 135,029 165,609 331,143
Net exchange differences 2,032 52,595 78,573 36,225 169,425
Effects due to changes in - - 375)( 1,411)( 1,786)(
consolidated entities
At December 31, 2013 2,067,214$ 4,460,652$ 1,973,569$ 2,245,248$ 10,746,683$
At December 31, 2013
Cost 2,067,214$ 6,474,369$ 5,483,009$ 7,017,449$ 21,042,041$
Accumulated depreciation - 2,013,717)( 3,509,440)( 4,772,201)( 10,295,358)(
and impairment
2,067,214$ 4,460,652$ 1,973,569$ 2,245,248$ 10,746,683$
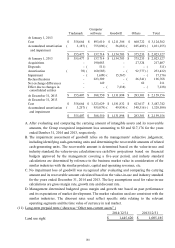
Computer
Trademark software Goodwill Others Total
At January 1, 2014
Cost 358,664$ 1,323,629$ 1,181,832$ 623,617$ 3,487,742$
Accumulated amortisation 3,257)( 935,079)( 49,934)( 340,316)( 1,328,586)(
and impairment
355,407$ 388,550$ 1,131,898$ 283,301$ 2,159,156$
At January 1, 2014 355,407$ 388,550$ 1,131,898$ 283,301$ 2,159,156$
Acquisitions 86 242,985 - 29,707 272,778
Disposals - 13)( - - 13)(
Amortisation 135)( 174,745)( - 93,468)( 268,348)(
Reclassifications - 14,325)( - 387)( 14,712)(
Net exchange differences - 38)( - 15)( 53)(
Effect due to changes in - 267)( - - 267)(
consolidated entities
At December 31, 2014 355,358$ 442,147$ 1,131,898$ 219,138$ 2,148,541$
At December 31, 2014
Cost 358,750$ 1,543,095$ 1,181,339$ 651,991$ 3,735,175$
Accumulated amortisation 3,392)( 1,100,948)( 49,441)( 432,853)( 1,586,634)(
and impairment
355,358$ 442,147$ 1,131,898$ 219,138$ 2,148,541$