Asus 2014 Annual Report Download - page 248
Download and view the complete annual report
Please find page 248 of the 2014 Asus annual report below. You can navigate through the pages in the report by either clicking on the pages listed below, or by using the keyword search tool below to find specific information within the annual report.-
 1
1 -
2
-
3
-
4
-
5
-
6
-
7
-
8
-
9
-
10
-
11
-
12
-
13
-
14
-
15
-
16
-
17
-
18
-
19
-
20
-
21
-
22
-
23
-
24
-
25
-
26
-
27
-
28
-
29
-
30
-
31
-
32
-
33
-
34
-
35
-
36
-
37
-
38
-
39
-
40
-
41
-
42
-
43
-
44
-
45
-
46
-
47
-
48
-
49
-
50
-
51
-
52
-
53
-
54
-
55
-
56
-
57
-
58
-
59
-
60
-
61
-
62
-
63
-
64
-
65
-
66
-
67
-
68
-
69
-
70
-
71
-
72
-
73
-
74
-
75
-
76
-
77
-
78
-
79
-
80
-
81
-
82
-
83
-
84
-
85
-
86
-
87
-
88
-
89
-
90
-
91
-
92
-
93
-
94
-
95
-
96
-
97
-
98
-
99
-
100
-
101
-
102
-
103
-
104
-
105
-
106
-
107
-
108
-
109
-
110
-
111
-
112
-
113
-
114
-
115
-
116
-
117
-
118
-
119
-
120
-
121
-
122
-
123
-
124
-
125
-
126
-
127
-
128
-
129
-
130
-
131
-
132
-
133
-
134
-
135
-
136
-
137
-
138
-
139
-
140
-
141
-
142
-
143
-
144
-
145
-
146
-
147
-
148
-
149
-
150
-
151
-
152
-
153
-
154
-
155
-
156
-
157
-
158
-
159
-
160
-
161
-
162
-
163
-
164
-
165
-
166
-
167
-
168
-
169
-
170
-
171
-
172
-
173
-
174
-
175
-
176
-
177
-
178
-
179
-
180
-
181
-
182
-
183
-
184
-
185
-
186
-
187
-
188
-
189
-
190
-
191
-
192
-
193
-
194
-
195
-
196
-
197
-
198
-
199
-
200
-
201
-
202
-
203
-
204
-
205
-
206
-
207
-
208
-
209
-
210
-
211
-
212
-
213
-
214
-
215
-
216
-
217
-
218
-
219
-
220
-
221
-
222
-
223
-
224
-
225
-
226
-
227
-
228
-
229
-
230
-
231
-
232
-
233
-
234
-
235
-
236
-
237
-
 238
238 -
 239
239 -
 240
240 -
 241
241 -
 242
242 -
 243
243 -
 244
244 -
 245
245 -
 246
246 -
 247
247 -
 248
248 -
 249
249 -
 250
250 -
 251
251 -
 252
252 -
 253
253 -
 254
254 -
 255
255 -
 256
256 -
 257
257 -
 258
258 -
259
-
260
-
261
-
262
-
263
-
264
-
265
-
266
-
267
-
268
 |
 |

244
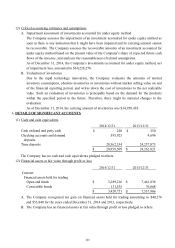
B. Associates
The financial information of the Company’s associates is summarized below:
C. On April 29, 2013, the Company disposed 103,017,000 shares of PEGA totaling $4,663,076 at
the average price of $45.27 (in dollars) per share. After this disposal, the Company’s ownership
percentage of PEGA was reduced to 19.59% and the Company has lost significant influence
over PEGA. The Company remeasured the investment retained in PEGA at its fair value, and
reclassified it to “available-for-sale financial assets - non-current”. The value difference
between the fair value and the carrying amount plus other comprehensive income previously
recognized in relation to PEGA was reclassified to profit for the period amounting to
$1,447,023.
D. The effect of changes in unrealized gain (loss) on valuation of available-for-sale financial assets
and cash flow hedges resulting from investments accounted for under equity method were
$619,181 and $251,033 for the years ended December 31, 2014 and 2013, respectively.
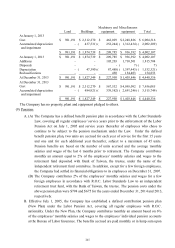
(8) Property, plant and equipment
Assets Liabilities Revenue Profit (loss)
2014/12/31 917,258$ 689,325$ 1,284,192$ 53,372)($
2013/12/31 965,495$ 691,193$ 1,958,818$ 22,801$
0
Machinery and Miscellaneous
Land Buildings equipment equipment Total
At January 1, 2014
Cost 981,191$ 2,312,270$ 567,532$ 4,095,092$ 7,956,085$
Accumulated depreciation - 484,921)( 339,582)( 2,691,246)( 3,515,749)(
and impairment
981,191$ 1,827,349$ 227,950$ 1,403,846$ 4,440,336$
At January 1, 2014 981,191$ 1,827,349$ 227,950$ 1,403,846$ 4,440,336$
Additions - - 80,675 378,208 458,883
Disposals - - - 139)( 139)(
Depreciation - 47,390)( 102,177)( 1,627,131)( 1,776,698)(
Reclassifications - - - 119,174 119,174
At December 31, 2014 981,191$ 1,779,959$ 206,448$ 273,958$ 3,241,556$
At December 31, 2014
Cost 981,191$ 2,312,270$ 648,080$ 4,589,503$ 8,531,044$
Accumulated depreciation - 532,311)( 441,632)( 4,315,545)( 5,289,488)(
and impairment
981,191$ 1,779,959$ 206,448$ 273,958$ 3,241,556$