Asus 2014 Annual Report Download - page 220
Download and view the complete annual report
Please find page 220 of the 2014 Asus annual report below. You can navigate through the pages in the report by either clicking on the pages listed below, or by using the keyword search tool below to find specific information within the annual report.-
 1
1 -
2
-
3
-
4
-
5
-
6
-
7
-
8
-
9
-
10
-
11
-
12
-
13
-
14
-
15
-
16
-
17
-
18
-
19
-
20
-
21
-
22
-
23
-
24
-
25
-
26
-
27
-
28
-
29
-
30
-
31
-
32
-
33
-
34
-
35
-
36
-
37
-
38
-
39
-
40
-
41
-
42
-
43
-
44
-
45
-
46
-
47
-
48
-
49
-
50
-
51
-
52
-
53
-
54
-
55
-
56
-
57
-
58
-
59
-
60
-
61
-
62
-
63
-
64
-
65
-
66
-
67
-
68
-
69
-
70
-
71
-
72
-
73
-
74
-
75
-
76
-
77
-
78
-
79
-
80
-
81
-
82
-
83
-
84
-
85
-
86
-
87
-
88
-
89
-
90
-
91
-
92
-
93
-
94
-
95
-
96
-
97
-
98
-
99
-
100
-
101
-
102
-
103
-
104
-
105
-
106
-
107
-
108
-
109
-
110
-
111
-
112
-
113
-
114
-
115
-
116
-
117
-
118
-
119
-
120
-
121
-
122
-
123
-
124
-
125
-
126
-
127
-
128
-
129
-
130
-
131
-
132
-
133
-
134
-
135
-
136
-
137
-
138
-
139
-
140
-
141
-
142
-
143
-
144
-
145
-
146
-
147
-
148
-
149
-
150
-
151
-
152
-
153
-
154
-
155
-
156
-
157
-
158
-
159
-
160
-
161
-
162
-
163
-
164
-
165
-
166
-
167
-
168
-
169
-
170
-
171
-
172
-
173
-
174
-
175
-
176
-
177
-
178
-
179
-
180
-
181
-
182
-
183
-
184
-
185
-
186
-
187
-
188
-
189
-
190
-
191
-
192
-
193
-
194
-
195
-
196
-
197
-
198
-
199
-
200
-
201
-
202
-
203
-
204
-
205
-
206
-
207
-
208
-
209
-
 210
210 -
 211
211 -
 212
212 -
 213
213 -
 214
214 -
 215
215 -
 216
216 -
 217
217 -
 218
218 -
 219
219 -
 220
220 -
 221
221 -
 222
222 -
 223
223 -
 224
224 -
 225
225 -
 226
226 -
 227
227 -
 228
228 -
 229
229 -
 230
230 -
231
-
232
-
233
-
234
-
235
-
236
-
237
-
238
-
239
-
240
-
241
-
242
-
243
-
244
-
245
-
246
-
247
-
248
-
249
-
250
-
251
-
252
-
253
-
254
-
255
-
256
-
257
-
258
-
259
-
260
-
261
-
262
-
263
-
264
-
265
-
266
-
267
-
268
 |
 |

216
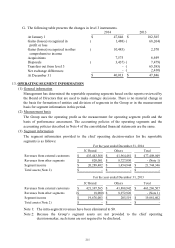
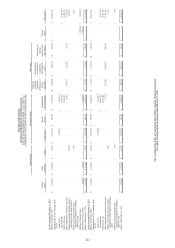
(4) Reconciliation for segment income
A. The intra-segment transactions are based on fair value. The revenues from external customers
reported to the chief operating decision-maker are measured in a manner consistent with the
consolidated statements of comprehensive income.
B. The reconciliation of the reportable operating segment’s profit (others are the same as
consolidated statements of comprehensive income) is as follows:
(5) Geographical information
Geographical information for the years ended December 31, 2014 and 2013 is as follows:
The above non-current assets exclude financing instruments, deferred income tax assets and
certain other non-current assets.
(6) Major customer information
No single customer accounts for more than 10% of the consolidated operating revenue for the
years ended December 31, 2014 and 2013.
2014 2013
Reportable operating segments’ profit 21,744,346$ 19,881,602$
before adjustment
Unallocated profit (loss) 34,382)( 45,592)(
Reportable operating segments’ profit 21,709,964$ 19,836,010$
For the years ended December 31,
Revenue
Non-current assets
Revenue
Non-current assets
Taiwan 65,831,059$ 7,657,990$ 60,735,758$ 9,173,917$
China 71,952,487 5,457,880 80,232,023 4,761,794
Singapore 233,097,713 5,428 216,126,709 1,487
USA 79,274,255 275,192 89,119,420 369,709
Europe 3,720,391 61,871 2,548,512 77,749
Others 23,532,144 441,980 14,524,085 344,938
477,408,049$ 13,900,341$ 463,286,507$ 14,729,594$
2014
2013
For the years ended December 31,