Asus 2014 Annual Report Download - page 183
Download and view the complete annual report
Please find page 183 of the 2014 Asus annual report below. You can navigate through the pages in the report by either clicking on the pages listed below, or by using the keyword search tool below to find specific information within the annual report.-
 1
1 -
2
-
3
-
4
-
5
-
6
-
7
-
8
-
9
-
10
-
11
-
12
-
13
-
14
-
15
-
16
-
17
-
18
-
19
-
20
-
21
-
22
-
23
-
24
-
25
-
26
-
27
-
28
-
29
-
30
-
31
-
32
-
33
-
34
-
35
-
36
-
37
-
38
-
39
-
40
-
41
-
42
-
43
-
44
-
45
-
46
-
47
-
48
-
49
-
50
-
51
-
52
-
53
-
54
-
55
-
56
-
57
-
58
-
59
-
60
-
61
-
62
-
63
-
64
-
65
-
66
-
67
-
68
-
69
-
70
-
71
-
72
-
73
-
74
-
75
-
76
-
77
-
78
-
79
-
80
-
81
-
82
-
83
-
84
-
85
-
86
-
87
-
88
-
89
-
90
-
91
-
92
-
93
-
94
-
95
-
96
-
97
-
98
-
99
-
100
-
101
-
102
-
103
-
104
-
105
-
106
-
107
-
108
-
109
-
110
-
111
-
112
-
113
-
114
-
115
-
116
-
117
-
118
-
119
-
120
-
121
-
122
-
123
-
124
-
125
-
126
-
127
-
128
-
129
-
130
-
131
-
132
-
133
-
134
-
135
-
136
-
137
-
138
-
139
-
140
-
141
-
142
-
143
-
144
-
145
-
146
-
147
-
148
-
149
-
150
-
151
-
152
-
153
-
154
-
155
-
156
-
157
-
158
-
159
-
160
-
161
-
162
-
163
-
164
-
165
-
166
-
167
-
168
-
169
-
170
-
171
-
172
-
 173
173 -
 174
174 -
 175
175 -
 176
176 -
 177
177 -
 178
178 -
 179
179 -
 180
180 -
 181
181 -
 182
182 -
 183
183 -
 184
184 -
 185
185 -
 186
186 -
 187
187 -
 188
188 -
 189
189 -
 190
190 -
 191
191 -
 192
192 -
 193
193 -
194
-
195
-
196
-
197
-
198
-
199
-
200
-
201
-
202
-
203
-
204
-
205
-
206
-
207
-
208
-
209
-
210
-
211
-
212
-
213
-
214
-
215
-
216
-
217
-
218
-
219
-
220
-
221
-
222
-
223
-
224
-
225
-
226
-
227
-
228
-
229
-
230
-
231
-
232
-
233
-
234
-
235
-
236
-
237
-
238
-
239
-
240
-
241
-
242
-
243
-
244
-
245
-
246
-
247
-
248
-
249
-
250
-
251
-
252
-
253
-
254
-
255
-
256
-
257
-
258
-
259
-
260
-
261
-
262
-
263
-
264
-
265
-
266
-
267
-
268
 |
 |

179
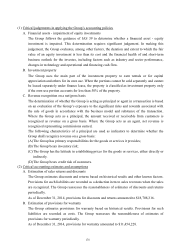
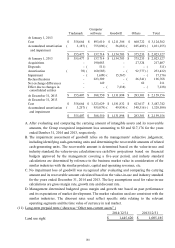
C. Impairment assessment of goodwill
The impairment assessment of goodwill relies on the Group’s subjective judgement, including
identifying cash-generating units, allocating assets and liabilities as well as goodwill to related
cash-generating units, and determining the recoverable amounts of related cash-generating
units.
D. Evaluation of inventories
Due to the rapid technology innovation, the Group evaluates the amounts of normal inventory
consumption, obsolete inventories or inventories without market selling value on the end of the
financial reporting period, and writes down the cost of inventories to the net realizable value.
Such an evaluation of inventories is principally based on the demand for the products within
the specified period in the future. Therefore, there might be material changes to the evaluation.
As of December 31, 2014, the carrying amount of inventories was $100,619,550.
6. DETAILS OF SIGNIFICANT ACCOUNTS
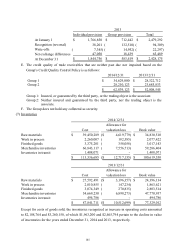
(1) Cash and cash equivalents
The Group has no cash and cash equivalents pledged to others.
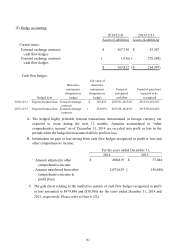
(2) Financial assets and liabilities at fair value through profit or loss
A. The Group recognized net gain (loss) on derivative financial instruments held for trading
amounting to $3,101,460 and ($194,781) and net gain (loss) on non-derivative financial
instruments held for trading amounting to $45,544 and $32,351 for the years ended December
31, 2014 and 2013, respectively.
2014/12/31 2013/12/31
Cash on hand and petty cash 8,398$ 10,252$
Checking accounts and demand deposits 25,036,126 17,698,879
Time deposits 54,069,021 48,814,387
Others 310 676
79,113,855$ 66,524,194$
2014/12/31 2013/12/31
Current:
Financial assets held for trading
Open-end funds 4,373,664$ 8,873,970$
Capital guaranteed instruments - 1,131,100
Listed and OTC stocks 176,298 127,988
Convertible bonds 131,535 76,068
Non-hedging derivatives 681,215 137,582
5,362,712$ 10,346,708$
Current:
Financial liabilities held for trading
Non-hedging derivatives 142,333$ 372,190$