Asus 2014 Annual Report Download - page 121
Download and view the complete annual report
Please find page 121 of the 2014 Asus annual report below. You can navigate through the pages in the report by either clicking on the pages listed below, or by using the keyword search tool below to find specific information within the annual report.-
 1
1 -
2
-
3
-
4
-
5
-
6
-
7
-
8
-
9
-
10
-
11
-
12
-
13
-
14
-
15
-
16
-
17
-
18
-
19
-
20
-
21
-
22
-
23
-
24
-
25
-
26
-
27
-
28
-
29
-
30
-
31
-
32
-
33
-
34
-
35
-
36
-
37
-
38
-
39
-
40
-
41
-
42
-
43
-
44
-
45
-
46
-
47
-
48
-
49
-
50
-
51
-
52
-
53
-
54
-
55
-
56
-
57
-
58
-
59
-
60
-
61
-
62
-
63
-
64
-
65
-
66
-
67
-
68
-
69
-
70
-
71
-
72
-
73
-
74
-
75
-
76
-
77
-
78
-
79
-
80
-
81
-
82
-
83
-
84
-
85
-
86
-
87
-
88
-
89
-
90
-
91
-
92
-
93
-
94
-
95
-
96
-
97
-
98
-
99
-
100
-
101
-
102
-
103
-
104
-
105
-
106
-
107
-
108
-
109
-
110
-
 111
111 -
 112
112 -
 113
113 -
 114
114 -
 115
115 -
 116
116 -
 117
117 -
 118
118 -
 119
119 -
 120
120 -
 121
121 -
 122
122 -
 123
123 -
 124
124 -
 125
125 -
 126
126 -
 127
127 -
 128
128 -
 129
129 -
 130
130 -
 131
131 -
132
-
133
-
134
-
135
-
136
-
137
-
138
-
139
-
140
-
141
-
142
-
143
-
144
-
145
-
146
-
147
-
148
-
149
-
150
-
151
-
152
-
153
-
154
-
155
-
156
-
157
-
158
-
159
-
160
-
161
-
162
-
163
-
164
-
165
-
166
-
167
-
168
-
169
-
170
-
171
-
172
-
173
-
174
-
175
-
176
-
177
-
178
-
179
-
180
-
181
-
182
-
183
-
184
-
185
-
186
-
187
-
188
-
189
-
190
-
191
-
192
-
193
-
194
-
195
-
196
-
197
-
198
-
199
-
200
-
201
-
202
-
203
-
204
-
205
-
206
-
207
-
208
-
209
-
210
-
211
-
212
-
213
-
214
-
215
-
216
-
217
-
218
-
219
-
220
-
221
-
222
-
223
-
224
-
225
-
226
-
227
-
228
-
229
-
230
-
231
-
232
-
233
-
234
-
235
-
236
-
237
-
238
-
239
-
240
-
241
-
242
-
243
-
244
-
245
-
246
-
247
-
248
-
249
-
250
-
251
-
252
-
253
-
254
-
255
-
256
-
257
-
258
-
259
-
260
-
261
-
262
-
263
-
264
-
265
-
266
-
267
-
268
 |
 |

117
117
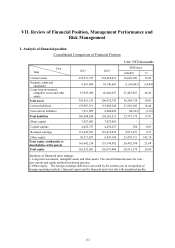
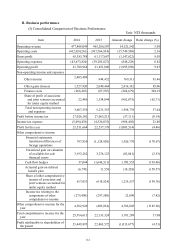
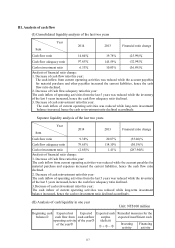
III. Analysis of cash flow
(I) Consolidated liquidity analysis of the last two years
Year
Item
2014 2013 Financial ratio change
Cash flow ratio 14.64% 19.78% (25.99)%
Cash flow adequacy ratio 97.63% 145.59% (32.94)%
Cash reinvestment ratio 6.33% 10.03% (36.89)%
Analysis of financial ratio change:
1. Decrease of cash flow ratio this year:
The cash inflow from current operating activities was reduced while the account payables
for material purchase and other payables increased the current liabilities, hence the cash
flow ratio declined.
2. Decrease of Cash flow adequacy ratio this year:
The cash inflow of operating activities from the last 5 years was reduced while the inventory
of the last 5 years increased, hence the cash flow adequacy ratio declined.
3. Decrease of cash reinvestment ratio this year:
The cash inflow of current operating activities was reduced while long-term investment
balance increased, hence the cash re-investment ratio declined accordingly.
Separate liquidity analysis of the last two years
Year
Item
2014 2013 Financial ratio change
Cash flow ratio 9.38% 20.87% (55.06)%
Cash flow adequacy ratio 79.65% 114.10% (30.19)%
Cash reinvestment ratio (2.65)% 1.41% (287.94)%
Analysis of financial ratio change:
1. Decrease of Cash flow ratio this year:
The cash inflow from current operating activities was reduced while the account payables for
material purchase and expenses increased the current liabilities, hence the cash flow ratio
declined.
2. Decrease of cash reinvestment ratio this year:
The cash inflow of operating activities from the last 5 years was reduced while the inventory
of the last 5 years increased, hence the cash flow adequacy ratio declined.
3.Decrease of cash reinvestment ratio this year:
The cash inflow of current operating activities was reduced while long-term investment
balance increased, hence the cash re-investment ratio declined accordingly.
(II) Analysis of cash liquidity in one year
Unit: NT$100 million
Beginning cash
balance
Expected net
cash flow from
operating activity
of the year
Expected
cash outflow
of the year
Expected cash
surplus
(deficit)
+-
Remedial measures for the
expected insufficient cash
Investing
activity
Financing
activity