Asus 2014 Annual Report Download - page 225
Download and view the complete annual report
Please find page 225 of the 2014 Asus annual report below. You can navigate through the pages in the report by either clicking on the pages listed below, or by using the keyword search tool below to find specific information within the annual report.-
 1
1 -
2
-
3
-
4
-
5
-
6
-
7
-
8
-
9
-
10
-
11
-
12
-
13
-
14
-
15
-
16
-
17
-
18
-
19
-
20
-
21
-
22
-
23
-
24
-
25
-
26
-
27
-
28
-
29
-
30
-
31
-
32
-
33
-
34
-
35
-
36
-
37
-
38
-
39
-
40
-
41
-
42
-
43
-
44
-
45
-
46
-
47
-
48
-
49
-
50
-
51
-
52
-
53
-
54
-
55
-
56
-
57
-
58
-
59
-
60
-
61
-
62
-
63
-
64
-
65
-
66
-
67
-
68
-
69
-
70
-
71
-
72
-
73
-
74
-
75
-
76
-
77
-
78
-
79
-
80
-
81
-
82
-
83
-
84
-
85
-
86
-
87
-
88
-
89
-
90
-
91
-
92
-
93
-
94
-
95
-
96
-
97
-
98
-
99
-
100
-
101
-
102
-
103
-
104
-
105
-
106
-
107
-
108
-
109
-
110
-
111
-
112
-
113
-
114
-
115
-
116
-
117
-
118
-
119
-
120
-
121
-
122
-
123
-
124
-
125
-
126
-
127
-
128
-
129
-
130
-
131
-
132
-
133
-
134
-
135
-
136
-
137
-
138
-
139
-
140
-
141
-
142
-
143
-
144
-
145
-
146
-
147
-
148
-
149
-
150
-
151
-
152
-
153
-
154
-
155
-
156
-
157
-
158
-
159
-
160
-
161
-
162
-
163
-
164
-
165
-
166
-
167
-
168
-
169
-
170
-
171
-
172
-
173
-
174
-
175
-
176
-
177
-
178
-
179
-
180
-
181
-
182
-
183
-
184
-
185
-
186
-
187
-
188
-
189
-
190
-
191
-
192
-
193
-
194
-
195
-
196
-
197
-
198
-
199
-
200
-
201
-
202
-
203
-
204
-
205
-
206
-
207
-
208
-
209
-
210
-
211
-
212
-
213
-
214
-
 215
215 -
 216
216 -
 217
217 -
 218
218 -
 219
219 -
 220
220 -
 221
221 -
 222
222 -
 223
223 -
 224
224 -
 225
225 -
 226
226 -
 227
227 -
 228
228 -
 229
229 -
 230
230 -
 231
231 -
 232
232 -
 233
233 -
 234
234 -
 235
235 -
236
-
237
-
238
-
239
-
240
-
241
-
242
-
243
-
244
-
245
-
246
-
247
-
248
-
249
-
250
-
251
-
252
-
253
-
254
-
255
-
256
-
257
-
258
-
259
-
260
-
261
-
262
-
263
-
264
-
265
-
266
-
267
-
268
 |
 |

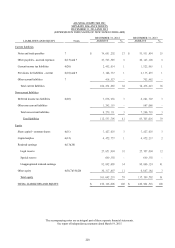
221
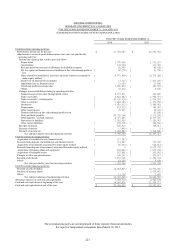
ASUSTEK COMPUTER INC.
SEPARATE STATEMENTS OF COMPREHENSIVE INCOME
FOR THE YEARS ENDED DECEMBER 31, 2014 AND 2013
(EXPRESSED IN THOUSANDS OF NEW TAIWAN DOLLARS, EXCEPT EARNINGS PER SHARE DATA)
The accompanying notes are an integral part of these separate financial statements.
See report of independent accountants dated March 19, 2015.
FOR THE YEARS ENDED DECEMBER 31,
2014
2013
Items
Notes
AMOUNT
%
AMOUNT
%
Operating revenue
6(15) and 7
$
384,234,950
100
$
358,741,099
100
Operating costs
6(6)(10)(13)(18)
(19) and 7
(
358,757,348
)
(
94
)
(
335,795,322
)
(
93
)
Gross profit
25,477,602
6
22,945,777
7
Unrealized (profit) loss from sales
(
1,049,817
)
-
249,992
-
Realized gross profit
24,427,785
6
23,195,769
7
Operating expenses
6(9)(10)(13)(18)
(19)(22), 7 and 9
Selling expenses
(
3,161,594
)
-
(
3,206,216
)
(
1
)
General and administrative expenses
(
3,157,102
)
(
1
)
(
2,959,634
)
(
1
)
Research and development expenses
(
7,423,778
)
(
2
)
(
7,254,703
)
(
2
)
Total operating expenses
(
13,742,474
)
(
3
)
(
13,420,553
)
(
4
)
Operating profit
10,685,311
3
9,775,216
3
Non-operating income and expenses
Other income
6(16)
1,894,380
-
1,281,587
-
Other gains (losses)
6(2)(3)(7)(17)
2,058,302
1
3,729,676
1
Finance costs
(
13,409
)
-
(
5
)
-
Share of profit of subsidiaries,
associates and joint ventures
accounted for under equity method
6(7)
8,751,499
2
10,775,288
3
Total non-operating income and
expenses
12,690,772
3
15,786,546
4
Profit before income tax
23,376,083
6
25,561,762
7
Income tax expenses
6(20)
(
3,905,674
)
(
1
)
(
4,111,867
)
(
1
)
Profit for the year
$
19,470,409
5
$
21,449,895
6
Other comprehensive income
Financial statements translation
differences of foreign operations
6(14)
$
2,696,772
1
$
745,749
-
Unrealized gain on valuation of
available-for-sale financial assets
6(3)(7)(14)
19,844,560
5
2,988,705
1
Share of other comprehensive income
of subsidiaries, associates and joint
ventures accounted for under equity
method
6(7)(14)
440,329
-
949,998
-
Income tax relating to the components
of other comprehensive income
6(14)(20)
473,943
-
(
307,826
)
-
Other comprehensive income for the
year
$
23,455,604
6
$
4,376,626
1
Total comprehensive income for the year
$
42,926,013
11
$
25,826,521
7
Earnings per share (In dollars)
6(21)
Basic earnings per share
$
26.21
$
28.66
Diluted earnings per share
$
26.07
$
28.47