Asus 2014 Annual Report Download - page 265
Download and view the complete annual report
Please find page 265 of the 2014 Asus annual report below. You can navigate through the pages in the report by either clicking on the pages listed below, or by using the keyword search tool below to find specific information within the annual report.-
 1
1 -
 2
2 -
 3
3 -
 4
4 -
 5
5 -
 6
6 -
 7
7 -
 8
8 -
 9
9 -
 10
10 -
 11
11 -
 12
12 -
 13
13 -
 14
14 -
 15
15 -
 16
16 -
 17
17 -
 18
18 -
 19
19 -
 20
20 -
 21
21 -
 22
22 -
 23
23 -
 24
24 -
 25
25 -
 26
26 -
 27
27 -
 28
28 -
 29
29 -
 30
30 -
 31
31 -
 32
32 -
 33
33 -
 34
34 -
 35
35 -
 36
36 -
 37
37 -
 38
38 -
 39
39 -
 40
40 -
 41
41 -
 42
42 -
 43
43 -
 44
44 -
 45
45 -
 46
46 -
 47
47 -
 48
48 -
 49
49 -
 50
50 -
 51
51 -
 52
52 -
 53
53 -
 54
54 -
 55
55 -
 56
56 -
 57
57 -
 58
58 -
 59
59 -
 60
60 -
 61
61 -
 62
62 -
 63
63 -
 64
64 -
 65
65 -
 66
66 -
 67
67 -
 68
68 -
 69
69 -
 70
70 -
 71
71 -
 72
72 -
 73
73 -
 74
74 -
 75
75 -
 76
76 -
 77
77 -
 78
78 -
 79
79 -
 80
80 -
 81
81 -
 82
82 -
 83
83 -
 84
84 -
 85
85 -
 86
86 -
 87
87 -
 88
88 -
 89
89 -
 90
90 -
 91
91 -
 92
92 -
 93
93 -
 94
94 -
 95
95 -
 96
96 -
 97
97 -
 98
98 -
 99
99 -
 100
100 -
 101
101 -
 102
102 -
 103
103 -
 104
104 -
 105
105 -
 106
106 -
 107
107 -
 108
108 -
 109
109 -
 110
110 -
 111
111 -
 112
112 -
 113
113 -
 114
114 -
 115
115 -
 116
116 -
 117
117 -
 118
118 -
 119
119 -
 120
120 -
 121
121 -
 122
122 -
 123
123 -
 124
124 -
 125
125 -
 126
126 -
 127
127 -
 128
128 -
 129
129 -
 130
130 -
 131
131 -
 132
132 -
 133
133 -
 134
134 -
 135
135 -
 136
136 -
 137
137 -
 138
138 -
 139
139 -
 140
140 -
 141
141 -
 142
142 -
 143
143 -
 144
144 -
 145
145 -
 146
146 -
 147
147 -
 148
148 -
 149
149 -
 150
150 -
 151
151 -
 152
152 -
 153
153 -
 154
154 -
 155
155 -
 156
156 -
 157
157 -
 158
158 -
 159
159 -
 160
160 -
 161
161 -
 162
162 -
 163
163 -
 164
164 -
 165
165 -
 166
166 -
 167
167 -
 168
168 -
 169
169 -
 170
170 -
 171
171 -
 172
172 -
 173
173 -
 174
174 -
 175
175 -
 176
176 -
 177
177 -
 178
178 -
 179
179 -
 180
180 -
 181
181 -
 182
182 -
 183
183 -
 184
184 -
 185
185 -
 186
186 -
 187
187 -
 188
188 -
 189
189 -
 190
190 -
 191
191 -
 192
192 -
 193
193 -
 194
194 -
 195
195 -
 196
196 -
 197
197 -
 198
198 -
 199
199 -
 200
200 -
 201
201 -
 202
202 -
 203
203 -
 204
204 -
 205
205 -
 206
206 -
 207
207 -
 208
208 -
 209
209 -
 210
210 -
 211
211 -
 212
212 -
 213
213 -
 214
214 -
 215
215 -
 216
216 -
 217
217 -
 218
218 -
 219
219 -
 220
220 -
 221
221 -
 222
222 -
 223
223 -
 224
224 -
 225
225 -
 226
226 -
 227
227 -
 228
228 -
 229
229 -
 230
230 -
 231
231 -
 232
232 -
 233
233 -
 234
234 -
 235
235 -
 236
236 -
 237
237 -
 238
238 -
 239
239 -
 240
240 -
 241
241 -
 242
242 -
 243
243 -
 244
244 -
 245
245 -
 246
246 -
 247
247 -
 248
248 -
 249
249 -
 250
250 -
 251
251 -
 252
252 -
 253
253 -
 254
254 -
 255
255 -
 256
256 -
 257
257 -
 258
258 -
 259
259 -
 260
260 -
 261
261 -
 262
262 -
 263
263 -
 264
264 -
 265
265 -
 266
266 -
 267
267 -
 268
268
 |
 |

261
b. No credit limits were exceeded during 2014 and 2013, and management does not expect
any significant losses from non-performance by these counterparties.
c. The credit quality information of financial assets that are neither past due nor impaired,
the aging analysis of financial assets that were past due but not impaired and the
individual analysis of financial assets that had been impaired is provided in the
statement for each type of financial assets as described in Note 6.
(B) Liquidity risk
a. Cash flow forecasting is performed in the operating entities of the Company and
aggregated by the Company treasury to monitor rolling forecasts of the Company’s
liquidity requirements and ensure it has sufficient cash to meet operational needs while
maintaining sufficient headroom at all times. Such forecasting takes into consideration
the Company’s cash flow plans and compliance with internal balance sheet ratio targets.
b. The Company’s treasury invests surplus cash in demand deposits, time deposits, money
market deposits and marketable securities, choosing instruments with appropriate
maturities or sufficient liquidity to provide sufficient headroom as determined by the
abovementioned forecasts. At December 31, 2014 and 2013, the Company held financial
assets at fair value through profit or loss of $3,420,751 and $7,537,906, respectively,
that are expected to readily generate cash inflows for managing liquidity risk.
c. The table below analyses the Company’s non-derivative financial liabilities into relevant
maturity groupings based on the remaining period at the end of the financial reporting
period to the contractual maturity date for non-derivative financial liabilities. The
amounts disclosed in the table are the contractual undiscounted cash flows.
d. The Company does not expect the timing of occurrence of the cash flows estimated
through the maturity date analysis to be significantly earlier, nor expect the actual cash
flow amount to be significantly different.
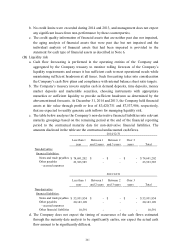
Less than 1
year
Between 1
and 2 years
Between 2
and 3 years
Over 3
years
Total
Non-derivative
financial liabilities:
Notes and trade payables
74,691,202$ -$ -$ -$ 74,691,202$
Other payables
- accrued expenses
23,523,585 - - - 23,523,585
2014/12/31
Less than 1
year
Between 1
and 2 years
Between 2
and 3 years
Over 3
years
Total
Non-derivative
financial liabilities:
Notes and trade payables 53,931,854$ -$ -$ -$ 53,931,854$
Other payables
- accrued expenses
20,143,109 - - - 20,143,109
Other financial liabilities
10,591 - - - 10,591
2013/12/31
