Asus 2014 Annual Report Download - page 192
Download and view the complete annual report
Please find page 192 of the 2014 Asus annual report below. You can navigate through the pages in the report by either clicking on the pages listed below, or by using the keyword search tool below to find specific information within the annual report.-
 1
1 -
2
-
3
-
4
-
5
-
6
-
7
-
8
-
9
-
10
-
11
-
12
-
13
-
14
-
15
-
16
-
17
-
18
-
19
-
20
-
21
-
22
-
23
-
24
-
25
-
26
-
27
-
28
-
29
-
30
-
31
-
32
-
33
-
34
-
35
-
36
-
37
-
38
-
39
-
40
-
41
-
42
-
43
-
44
-
45
-
46
-
47
-
48
-
49
-
50
-
51
-
52
-
53
-
54
-
55
-
56
-
57
-
58
-
59
-
60
-
61
-
62
-
63
-
64
-
65
-
66
-
67
-
68
-
69
-
70
-
71
-
72
-
73
-
74
-
75
-
76
-
77
-
78
-
79
-
80
-
81
-
82
-
83
-
84
-
85
-
86
-
87
-
88
-
89
-
90
-
91
-
92
-
93
-
94
-
95
-
96
-
97
-
98
-
99
-
100
-
101
-
102
-
103
-
104
-
105
-
106
-
107
-
108
-
109
-
110
-
111
-
112
-
113
-
114
-
115
-
116
-
117
-
118
-
119
-
120
-
121
-
122
-
123
-
124
-
125
-
126
-
127
-
128
-
129
-
130
-
131
-
132
-
133
-
134
-
135
-
136
-
137
-
138
-
139
-
140
-
141
-
142
-
143
-
144
-
145
-
146
-
147
-
148
-
149
-
150
-
151
-
152
-
153
-
154
-
155
-
156
-
157
-
158
-
159
-
160
-
161
-
162
-
163
-
164
-
165
-
166
-
167
-
168
-
169
-
170
-
171
-
172
-
173
-
174
-
175
-
176
-
177
-
178
-
179
-
180
-
181
-
 182
182 -
 183
183 -
 184
184 -
 185
185 -
 186
186 -
 187
187 -
 188
188 -
 189
189 -
 190
190 -
 191
191 -
 192
192 -
 193
193 -
 194
194 -
 195
195 -
 196
196 -
 197
197 -
 198
198 -
 199
199 -
 200
200 -
 201
201 -
 202
202 -
203
-
204
-
205
-
206
-
207
-
208
-
209
-
210
-
211
-
212
-
213
-
214
-
215
-
216
-
217
-
218
-
219
-
220
-
221
-
222
-
223
-
224
-
225
-
226
-
227
-
228
-
229
-
230
-
231
-
232
-
233
-
234
-
235
-
236
-
237
-
238
-
239
-
240
-
241
-
242
-
243
-
244
-
245
-
246
-
247
-
248
-
249
-
250
-
251
-
252
-
253
-
254
-
255
-
256
-
257
-
258
-
259
-
260
-
261
-
262
-
263
-
264
-
265
-
266
-
267
-
268
 |
 |

188
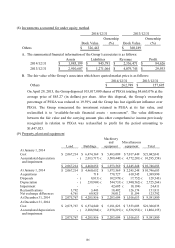
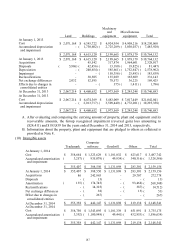
A. After evaluating and comparing the carrying amount of intangible assets and its recoverable
amounts, the Group recognized impairment loss amounting to $0 and $17,176 for the years
ended Dember 31, 2014 and 2013, respectively.
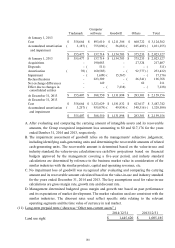
B. The impairment assessment of goodwill relies on the managements’ subjective judgement,
including identifying cash-generating units and determining the recoverable amounts of related
cash-generating units. The recoverable amount is determined based on the value-in-use and
industry standard, the value-in-use calculations use cash flow projections based on financial
budgets approved by the management covering a five-year period, and industy standard
calculations are determined by reference to the business market value in consideration of the
similar industries with the similar products, capital and operating revenues, etc.
C. No impairment loss of goodwill was recognized after evaluating and comparing the carrying
amount and its recoverable amount calculated based on the value-in-use and industry standard
for the years ended December 31, 2014 and 2013. The key assumptions used for value-in-use
calculations are gross margin rate, growth rate and discount rate.
D. Management determined budgeted gross margin and growth rate based on past performance
and its expectations of market development. The market valuation used are consistent with the
similar industries. The discount rates used reflect specific risks relating to the relevant
operating segments and the time value of currency in real market.
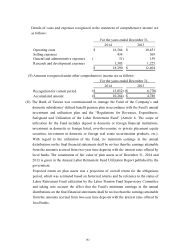
(11) Long-term prepaid rents ( shown as “Other non-current assets” )
Computer
Trademark software Goodwill Others Total
At January 1, 2013
Cost 358,664$ 893,610$ 1,211,386$ 660,722$ 3,124,382$
Accumulated amortisation 3,187)( 755,896)( 56,683)( 285,489)( 1,101,255)(
and impairment
355,477$ 137,714$ 1,154,703$ 375,233$ 2,023,127$
At January 1, 2013 355,477$ 137,714$ 1,154,703$ 375,233$ 2,023,127$
Acquisitions - 190,083 - 27,324 217,407
Disposals - 511)( - - 511)(
Amortisation 70)( 160,585)( - 92,777)( 253,432)(
Impairment - 1,609)( 15,567)( - 17,176)(
Reclassifications - 223,309 - 26,541)( 196,768
Net exchange differences - 149 - 62 211
Effect due to changes in - - 7,238)( - 7,238)(
consolidated entities
At December 31, 2013 355,407$ 388,550$ 1,131,898$ 283,301$ 2,159,156$
At December 31, 2013
Cost 358,664$ 1,323,629$ 1,181,832$ 623,617$ 3,487,742$
Accumulated amortisation 3,257)( 935,079)( 49,934)( 340,316)( 1,328,586)(
and impairment
355,407$ 388,550$ 1,131,898$ 283,301$ 2,159,156$
2014/12/31 2013/12/31
Land use right 1,445,620$ 1,005,185$