Asus 2014 Annual Report Download - page 120
Download and view the complete annual report
Please find page 120 of the 2014 Asus annual report below. You can navigate through the pages in the report by either clicking on the pages listed below, or by using the keyword search tool below to find specific information within the annual report.-
 1
1 -
2
-
3
-
4
-
5
-
6
-
7
-
8
-
9
-
10
-
11
-
12
-
13
-
14
-
15
-
16
-
17
-
18
-
19
-
20
-
21
-
22
-
23
-
24
-
25
-
26
-
27
-
28
-
29
-
30
-
31
-
32
-
33
-
34
-
35
-
36
-
37
-
38
-
39
-
40
-
41
-
42
-
43
-
44
-
45
-
46
-
47
-
48
-
49
-
50
-
51
-
52
-
53
-
54
-
55
-
56
-
57
-
58
-
59
-
60
-
61
-
62
-
63
-
64
-
65
-
66
-
67
-
68
-
69
-
70
-
71
-
72
-
73
-
74
-
75
-
76
-
77
-
78
-
79
-
80
-
81
-
82
-
83
-
84
-
85
-
86
-
87
-
88
-
89
-
90
-
91
-
92
-
93
-
94
-
95
-
96
-
97
-
98
-
99
-
100
-
101
-
102
-
103
-
104
-
105
-
106
-
107
-
108
-
109
-
 110
110 -
 111
111 -
 112
112 -
 113
113 -
 114
114 -
 115
115 -
 116
116 -
 117
117 -
 118
118 -
 119
119 -
 120
120 -
 121
121 -
 122
122 -
 123
123 -
 124
124 -
 125
125 -
 126
126 -
 127
127 -
 128
128 -
 129
129 -
 130
130 -
131
-
132
-
133
-
134
-
135
-
136
-
137
-
138
-
139
-
140
-
141
-
142
-
143
-
144
-
145
-
146
-
147
-
148
-
149
-
150
-
151
-
152
-
153
-
154
-
155
-
156
-
157
-
158
-
159
-
160
-
161
-
162
-
163
-
164
-
165
-
166
-
167
-
168
-
169
-
170
-
171
-
172
-
173
-
174
-
175
-
176
-
177
-
178
-
179
-
180
-
181
-
182
-
183
-
184
-
185
-
186
-
187
-
188
-
189
-
190
-
191
-
192
-
193
-
194
-
195
-
196
-
197
-
198
-
199
-
200
-
201
-
202
-
203
-
204
-
205
-
206
-
207
-
208
-
209
-
210
-
211
-
212
-
213
-
214
-
215
-
216
-
217
-
218
-
219
-
220
-
221
-
222
-
223
-
224
-
225
-
226
-
227
-
228
-
229
-
230
-
231
-
232
-
233
-
234
-
235
-
236
-
237
-
238
-
239
-
240
-
241
-
242
-
243
-
244
-
245
-
246
-
247
-
248
-
249
-
250
-
251
-
252
-
253
-
254
-
255
-
256
-
257
-
258
-
259
-
260
-
261
-
262
-
263
-
264
-
265
-
266
-
267
-
268
 |
 |

116
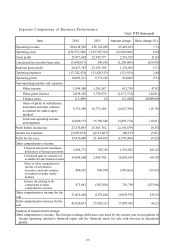
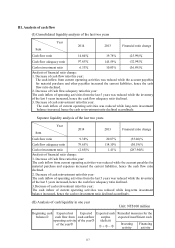
Separate Comparison of Business Performance
Unit: NT$ thousands
Item 2014 2013 Amount change Ratio change (%)
Operating revenue 384,234,950 358,741,099 25,493,851 7.11
Operating costs (358,757,348) (335,795,322) (22,962,026) 6.84
Gross profit 25,477,602 22,945,777 2,531,825 11.03
Unrealized loss (profit) from sales (1,049,817) 249,992 (1,299,809) (519.94)
Realized gross profit 24,427,785 23,195,769 1,232,016 5.31
Operating expenses (13,742,474) (13,420,553) (321,921) 2.40
Operating profit 10,685,311 9,775,216 910,095 9.31
Non-operating income and expenses
Other income 1,894,380 1,281,587 612,793 47.82
Other gains (losses) 2,058,302 3,729,676 (1,671,374) (44.81)
Finance costs (13,409) (5) (13,404) 268080.00
Share of profit of subsidiaries,
associates and joint ventures
accounted for under equity
method
8,751,499 10,775,288 (2,023,789) (18.78)
Total non-operating income
and expenses 12,690,772 15,786,546 (3,095,774) (19.61)
Profit before income tax 23,376,083 25,561,762 (2,185,679) (8.55)
Income tax expenses (3,905,674) (4,111,867) 206,193 (5.01)
Profit for the year 19,470,409 21,449,895 (1,979,486) (9.23)
Other comprehensive income
Financial statements translation
differences of foreign operations 2,696,772 745,749 1,951,023 261.62
Unrealized gain on valuation of
available-for-sale financial assets 19,844,560 2,988,705 16,855,855 563.99
Share of other comprehensive
income of subsidiaries,
associates and joint ventures
accounted for under equity
method
440,329 949,998 (509,669) (53.65)
Income tax relating to the
components of other
comprehensive income
473,943 (307,826) 781,769 (253.96)
Other comprehensive income for the
year 23,455,604 4,376,626 19,078,978 435.93
Total comprehensive income for the
year 42,926,013 25,826,521 17,099,492 66.21
Analysis of financial ratio change:
Other comprehensive income: The foreign exchange difference converted by the current year in recognition o
f
foreign operating institute’s financial report and the financial assets for sale with increase in unrealized
profits.