Asus 2014 Annual Report Download - page 256
Download and view the complete annual report
Please find page 256 of the 2014 Asus annual report below. You can navigate through the pages in the report by either clicking on the pages listed below, or by using the keyword search tool below to find specific information within the annual report.-
 1
1 -
2
-
3
-
4
-
5
-
6
-
7
-
8
-
9
-
10
-
11
-
12
-
13
-
14
-
15
-
16
-
17
-
18
-
19
-
20
-
21
-
22
-
23
-
24
-
25
-
26
-
27
-
28
-
29
-
30
-
31
-
32
-
33
-
34
-
35
-
36
-
37
-
38
-
39
-
40
-
41
-
42
-
43
-
44
-
45
-
46
-
47
-
48
-
49
-
50
-
51
-
52
-
53
-
54
-
55
-
56
-
57
-
58
-
59
-
60
-
61
-
62
-
63
-
64
-
65
-
66
-
67
-
68
-
69
-
70
-
71
-
72
-
73
-
74
-
75
-
76
-
77
-
78
-
79
-
80
-
81
-
82
-
83
-
84
-
85
-
86
-
87
-
88
-
89
-
90
-
91
-
92
-
93
-
94
-
95
-
96
-
97
-
98
-
99
-
100
-
101
-
102
-
103
-
104
-
105
-
106
-
107
-
108
-
109
-
110
-
111
-
112
-
113
-
114
-
115
-
116
-
117
-
118
-
119
-
120
-
121
-
122
-
123
-
124
-
125
-
126
-
127
-
128
-
129
-
130
-
131
-
132
-
133
-
134
-
135
-
136
-
137
-
138
-
139
-
140
-
141
-
142
-
143
-
144
-
145
-
146
-
147
-
148
-
149
-
150
-
151
-
152
-
153
-
154
-
155
-
156
-
157
-
158
-
159
-
160
-
161
-
162
-
163
-
164
-
165
-
166
-
167
-
168
-
169
-
170
-
171
-
172
-
173
-
174
-
175
-
176
-
177
-
178
-
179
-
180
-
181
-
182
-
183
-
184
-
185
-
186
-
187
-
188
-
189
-
190
-
191
-
192
-
193
-
194
-
195
-
196
-
197
-
198
-
199
-
200
-
201
-
202
-
203
-
204
-
205
-
206
-
207
-
208
-
209
-
210
-
211
-
212
-
213
-
214
-
215
-
216
-
217
-
218
-
219
-
220
-
221
-
222
-
223
-
224
-
225
-
226
-
227
-
228
-
229
-
230
-
231
-
232
-
233
-
234
-
235
-
236
-
237
-
238
-
239
-
240
-
241
-
242
-
243
-
244
-
245
-
 246
246 -
 247
247 -
 248
248 -
 249
249 -
 250
250 -
 251
251 -
 252
252 -
 253
253 -
 254
254 -
 255
255 -
 256
256 -
 257
257 -
 258
258 -
 259
259 -
 260
260 -
 261
261 -
 262
262 -
 263
263 -
 264
264 -
 265
265 -
 266
266 -
267
-
268
 |
 |

252
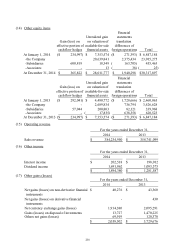
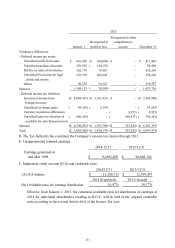
(B) The income tax relating to components of other comprehensive income is as follows:
B. Reconciliation between income tax expenses and accounting profit:
C. Amounts of deferred income tax assets or liabilities as a result of temporary differences are as
follows:
2014 2013
Changes in fair value on 795,281)($ 298,871$
available-for-sale financial assets
Currency translation differences 321,338 8,955
473,943)($ 307,826$
For the years ended December 31,
2014 2013
Income tax calculated based on profit before tax 3,973,934$ 4,345,500$
and statutory tax rate
Tax exempt income by tax regulation 295,604)( 441,035)(
Investment gains (losses) disallowed by tax regulation
150,843)( 151,040)(
Additional 10% tax on unappropriated earnings 481,059 587,765
Difference between prior year’s income tax 853 136,394)(
estimation and assessed results
Others 103,725)( 92,929)(
Income tax expenses 3,905,674$ 4,111,867$
For the years ended December 31,
January 1
Recognized in
profit or loss
Recognized in other
comprehensive
income
December 31
Temporary differences:
- Deferred income tax assets:
Unrealized profit from sales 417,405$ 240,911$ -$ 658,316$
Unrealized purchase discounts 89,460 88,644)( - 816
Decline in value of inventories 438,246 206,525 - 644,771
Unrealized Provisions for legal 358,228 158,165 - 516,393
claims and royalty
Others 130,397 21,077 - 151,474
Subtotal 1,433,736$ 538,034$ -$ 1,971,770$
- Deferred income tax liabilities:
Investment income from 5,385,886)($ 1,293,785)($ -$ 6,679,671)($
foreign investees
Unrealized exchange gains 91,585)( 64,611 - 26,974)(
Currency translation differences 8,955)( - 321,338)( 330,293)(
Unrealized gain on valuation of 795,281)( - 795,281 -
available-for-sale financial assets
Subtotal 6,281,707)($ 1,229,174)($ 473,943$ 7,036,938)($
Total 4,847,971)($ 691,140)($ 473,943$ 5,065,168)($
2014