Asus 2014 Annual Report Download - page 215
Download and view the complete annual report
Please find page 215 of the 2014 Asus annual report below. You can navigate through the pages in the report by either clicking on the pages listed below, or by using the keyword search tool below to find specific information within the annual report.-
 1
1 -
2
-
3
-
4
-
5
-
6
-
7
-
8
-
9
-
10
-
11
-
12
-
13
-
14
-
15
-
16
-
17
-
18
-
19
-
20
-
21
-
22
-
23
-
24
-
25
-
26
-
27
-
28
-
29
-
30
-
31
-
32
-
33
-
34
-
35
-
36
-
37
-
38
-
39
-
40
-
41
-
42
-
43
-
44
-
45
-
46
-
47
-
48
-
49
-
50
-
51
-
52
-
53
-
54
-
55
-
56
-
57
-
58
-
59
-
60
-
61
-
62
-
63
-
64
-
65
-
66
-
67
-
68
-
69
-
70
-
71
-
72
-
73
-
74
-
75
-
76
-
77
-
78
-
79
-
80
-
81
-
82
-
83
-
84
-
85
-
86
-
87
-
88
-
89
-
90
-
91
-
92
-
93
-
94
-
95
-
96
-
97
-
98
-
99
-
100
-
101
-
102
-
103
-
104
-
105
-
106
-
107
-
108
-
109
-
110
-
111
-
112
-
113
-
114
-
115
-
116
-
117
-
118
-
119
-
120
-
121
-
122
-
123
-
124
-
125
-
126
-
127
-
128
-
129
-
130
-
131
-
132
-
133
-
134
-
135
-
136
-
137
-
138
-
139
-
140
-
141
-
142
-
143
-
144
-
145
-
146
-
147
-
148
-
149
-
150
-
151
-
152
-
153
-
154
-
155
-
156
-
157
-
158
-
159
-
160
-
161
-
162
-
163
-
164
-
165
-
166
-
167
-
168
-
169
-
170
-
171
-
172
-
173
-
174
-
175
-
176
-
177
-
178
-
179
-
180
-
181
-
182
-
183
-
184
-
185
-
186
-
187
-
188
-
189
-
190
-
191
-
192
-
193
-
194
-
195
-
196
-
197
-
198
-
199
-
200
-
201
-
202
-
203
-
204
-
 205
205 -
 206
206 -
 207
207 -
 208
208 -
 209
209 -
 210
210 -
 211
211 -
 212
212 -
 213
213 -
 214
214 -
 215
215 -
 216
216 -
 217
217 -
 218
218 -
 219
219 -
 220
220 -
 221
221 -
 222
222 -
 223
223 -
 224
224 -
 225
225 -
226
-
227
-
228
-
229
-
230
-
231
-
232
-
233
-
234
-
235
-
236
-
237
-
238
-
239
-
240
-
241
-
242
-
243
-
244
-
245
-
246
-
247
-
248
-
249
-
250
-
251
-
252
-
253
-
254
-
255
-
256
-
257
-
258
-
259
-
260
-
261
-
262
-
263
-
264
-
265
-
266
-
267
-
268
 |
 |
211
b. No credit limits were exceeded during the years ended December 31, 2014 and 2013,
and management does not expect any significant losses from non-performance by these
counterparties.
c. The credit quality information of financial assets that are neither past due nor impaired,
the ageing analysis of financial assets that were past due but not impaired and the
individual analysis of financial assets that had been impaired is provided in the
statement for each type of financial assets as described in Note 6.
(C) Liquidity risk
a. Cash flow forecasting is performed in the operating entities of the Group and aggregated
by the Group treasury. The Group treasury monitors rolling forecasts of the Group’s
liquidity requirements to ensure it has sufficient cash to meet operational needs while
maintaining sufficient headroom on its undrawn committed borrowing facilities at all
times so that the Group does not breach borrowing limits or covenants on any of its
borrowing facilities. Such forecasting takes into consideration the Group’s cash flow
plans and compliance with internal balance sheet ratio targets.
b. The Group treasury invests surplus cash in demand deposits, time deposits, money
market deposits and marketable securities, choosing instruments with appropriate
maturities or sufficient liquidity to provide sufficient headroom as determined by the
abovementioned forecasts. At December 31, 2014 and 2013, the Group held financial
assets at fair value through profit or loss of $4,681,497 and $10,209,126, respectively,
that are expected to readily generate cash inflows for managing liquidity risk.
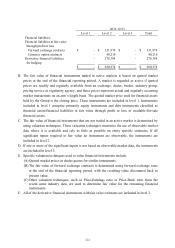
c. The table below analyses the Group’s non-derivative financial liabilities and derivative
financial liabilities into relevant maturity groupings based on the remaining period at the
end of the financial reporting period to the contractual maturity date for non-derivative
financial liabilities and to the expected maturity date for derivative financial liabilities.
The amounts disclosed in the table are the contractual undiscounted cash flows.