Asus 2014 Annual Report Download - page 116
Download and view the complete annual report
Please find page 116 of the 2014 Asus annual report below. You can navigate through the pages in the report by either clicking on the pages listed below, or by using the keyword search tool below to find specific information within the annual report.-
 1
1 -
2
-
3
-
4
-
5
-
6
-
7
-
8
-
9
-
10
-
11
-
12
-
13
-
14
-
15
-
16
-
17
-
18
-
19
-
20
-
21
-
22
-
23
-
24
-
25
-
26
-
27
-
28
-
29
-
30
-
31
-
32
-
33
-
34
-
35
-
36
-
37
-
38
-
39
-
40
-
41
-
42
-
43
-
44
-
45
-
46
-
47
-
48
-
49
-
50
-
51
-
52
-
53
-
54
-
55
-
56
-
57
-
58
-
59
-
60
-
61
-
62
-
63
-
64
-
65
-
66
-
67
-
68
-
69
-
70
-
71
-
72
-
73
-
74
-
75
-
76
-
77
-
78
-
79
-
80
-
81
-
82
-
83
-
84
-
85
-
86
-
87
-
88
-
89
-
90
-
91
-
92
-
93
-
94
-
95
-
96
-
97
-
98
-
99
-
100
-
101
-
102
-
103
-
104
-
105
-
 106
106 -
 107
107 -
 108
108 -
 109
109 -
 110
110 -
 111
111 -
 112
112 -
 113
113 -
 114
114 -
 115
115 -
 116
116 -
 117
117 -
 118
118 -
 119
119 -
 120
120 -
 121
121 -
 122
122 -
 123
123 -
 124
124 -
 125
125 -
 126
126 -
127
-
128
-
129
-
130
-
131
-
132
-
133
-
134
-
135
-
136
-
137
-
138
-
139
-
140
-
141
-
142
-
143
-
144
-
145
-
146
-
147
-
148
-
149
-
150
-
151
-
152
-
153
-
154
-
155
-
156
-
157
-
158
-
159
-
160
-
161
-
162
-
163
-
164
-
165
-
166
-
167
-
168
-
169
-
170
-
171
-
172
-
173
-
174
-
175
-
176
-
177
-
178
-
179
-
180
-
181
-
182
-
183
-
184
-
185
-
186
-
187
-
188
-
189
-
190
-
191
-
192
-
193
-
194
-
195
-
196
-
197
-
198
-
199
-
200
-
201
-
202
-
203
-
204
-
205
-
206
-
207
-
208
-
209
-
210
-
211
-
212
-
213
-
214
-
215
-
216
-
217
-
218
-
219
-
220
-
221
-
222
-
223
-
224
-
225
-
226
-
227
-
228
-
229
-
230
-
231
-
232
-
233
-
234
-
235
-
236
-
237
-
238
-
239
-
240
-
241
-
242
-
243
-
244
-
245
-
246
-
247
-
248
-
249
-
250
-
251
-
252
-
253
-
254
-
255
-
256
-
257
-
258
-
259
-
260
-
261
-
262
-
263
-
264
-
265
-
266
-
267
-
268
 |
 |

112
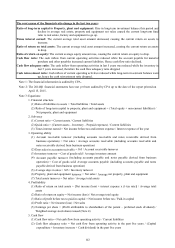
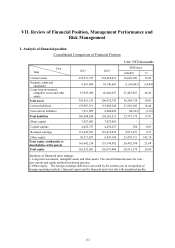
VII. Review of Financial Position, Management Performance and
Risk Management
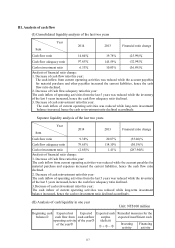
I. Analysis of financial position
Consolidated Comparison of Financial Position
Unit: NT$ thousands
Year
Item 2013 2012
Difference
Amount %
Current assets 274,913,727 238,864,019 36,049,708 15.09
Property, plant and
equipment 9,581,880 10,746,683 (1,164,803) (10.84)
Long-term investment,
intangible assets and other
assets
67,925,906 46,462,053 21,463,853 46.20
Total assets 352,421,513 296,072,755 56,348,758 19.03
Current liabilities 178,987,351 151,095,249 27,892,102 18.46
Non-current liabilities 7,911,099 8,006,022 (94,923) (1.19)
Total liabilities 186,898,450 159,101,271 27,797,179 17.47
Share capital 7,427,603 7,427,603 - -
Capital surplus 4,452,757 4,452,237 520 0.01
Retained earnings 121,443,953 116,472,478 4,971,475 4.27
Other equity 30,317,897 6,847,184 23,470,713 342.78
Total equity attributable to
shareholders of the parent 163,642,210 135,199,502 28,442,708 21.04
Total equity 165,523,063 136,971,484 28,551,579 20.84
Analysis of financial ratio change:
1. Long-term investment, intangible assets and other assets: The current financial assets for sale –
non-current and equity method investment increase.
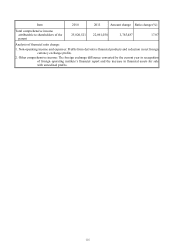
2. Other equity: The foreign exchange difference converted by the current year in recognition of
foreign operating institute’s financial report and the financial assets for sale with unrealized profits.