Asus 2014 Annual Report Download - page 211
Download and view the complete annual report
Please find page 211 of the 2014 Asus annual report below. You can navigate through the pages in the report by either clicking on the pages listed below, or by using the keyword search tool below to find specific information within the annual report.-
 1
1 -
2
-
3
-
4
-
5
-
6
-
7
-
8
-
9
-
10
-
11
-
12
-
13
-
14
-
15
-
16
-
17
-
18
-
19
-
20
-
21
-
22
-
23
-
24
-
25
-
26
-
27
-
28
-
29
-
30
-
31
-
32
-
33
-
34
-
35
-
36
-
37
-
38
-
39
-
40
-
41
-
42
-
43
-
44
-
45
-
46
-
47
-
48
-
49
-
50
-
51
-
52
-
53
-
54
-
55
-
56
-
57
-
58
-
59
-
60
-
61
-
62
-
63
-
64
-
65
-
66
-
67
-
68
-
69
-
70
-
71
-
72
-
73
-
74
-
75
-
76
-
77
-
78
-
79
-
80
-
81
-
82
-
83
-
84
-
85
-
86
-
87
-
88
-
89
-
90
-
91
-
92
-
93
-
94
-
95
-
96
-
97
-
98
-
99
-
100
-
101
-
102
-
103
-
104
-
105
-
106
-
107
-
108
-
109
-
110
-
111
-
112
-
113
-
114
-
115
-
116
-
117
-
118
-
119
-
120
-
121
-
122
-
123
-
124
-
125
-
126
-
127
-
128
-
129
-
130
-
131
-
132
-
133
-
134
-
135
-
136
-
137
-
138
-
139
-
140
-
141
-
142
-
143
-
144
-
145
-
146
-
147
-
148
-
149
-
150
-
151
-
152
-
153
-
154
-
155
-
156
-
157
-
158
-
159
-
160
-
161
-
162
-
163
-
164
-
165
-
166
-
167
-
168
-
169
-
170
-
171
-
172
-
173
-
174
-
175
-
176
-
177
-
178
-
179
-
180
-
181
-
182
-
183
-
184
-
185
-
186
-
187
-
188
-
189
-
190
-
191
-
192
-
193
-
194
-
195
-
196
-
197
-
198
-
199
-
200
-
 201
201 -
 202
202 -
 203
203 -
 204
204 -
 205
205 -
 206
206 -
 207
207 -
 208
208 -
 209
209 -
 210
210 -
 211
211 -
 212
212 -
 213
213 -
 214
214 -
 215
215 -
 216
216 -
 217
217 -
 218
218 -
 219
219 -
 220
220 -
 221
221 -
222
-
223
-
224
-
225
-
226
-
227
-
228
-
229
-
230
-
231
-
232
-
233
-
234
-
235
-
236
-
237
-
238
-
239
-
240
-
241
-
242
-
243
-
244
-
245
-
246
-
247
-
248
-
249
-
250
-
251
-
252
-
253
-
254
-
255
-
256
-
257
-
258
-
259
-
260
-
261
-
262
-
263
-
264
-
265
-
266
-
267
-
268
 |
 |

207
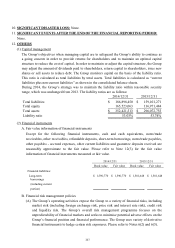
10. SIGNIFICANT DISASTER LOSS: None.
11. SIGNIFICANT EVENTS AFTER THE END OF THE FINANCIAL REPORTING PERIOD:
None.
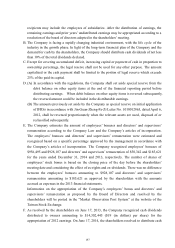
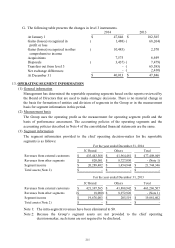
12. OTHERS
(1) Capital management
The Group’s objectives when managing capital are to safeguard the Group’s ability to continue as
a going concern in order to provide returns for shareholders and to maintain an optimal capital
structure to reduce the cost of capital. In order to maintain or adjust the capital structure, the Group
may adjust the amount of dividends paid to shareholders, return capital to shareholders, issue new
shares or sell assets to reduce debt. The Group monitors capital on the basis of the liability ratio.
This ratio is calculated as total liabilities by total assets. Total liabilities is calculated as “current
liabilities plus non-current liabilities” as shown in the consolidated balance sheets.
During 2014, the Group’s strategy was to maintain the liability ratio within reasonable security
range, which was unchanged from 2013. The liability ratios are as follows:
(2) Financial instruments
A. Fair value information of financial instruments
Except for the following financial instruments, cash and cash equivalents, notes/trade
receivables, other receivables, refundable deposits, short-term borrowings, notes/trade payables,
other payables - accrued expenses, other current liabilities and guarantee deposits received are
reasonably approximate to the fair value. Please refer to Note 12(3) for the fair value
information of financial instruments measured at fair value.
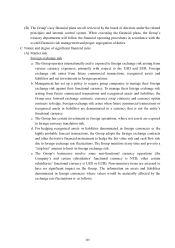
B. Financial risk management policies
(A) The Group’s operating activities expose the Group to a variety of financial risks, including
market risk (including foreign exchange risk, price risk and interest rate risk), credit risk
and liquidity risk. The Group’s overall risk management programme focuses on the
unpredictability of financial markets and seeks to minimise potential adverse effects on the
Group’s financial position and financial performance. The Group uses variety of derivative
financial instruments to hedge certain risk exposures. Please refer to Notes 6(2) and 6(5).
2014/12/31 2013/12/31
Total liabilities 186,898,450$ 159,101,271$
Total equity 165,523,063 136,971,484
Total assets 352,421,513$ 296,072,755$
Liability ratio 53.03% 53.74%
Book value Fair value Book value Fair value
Financial liabilities:
Long-term 1,590,770$ 1,590,770$ 1,501,648$ 1,501,648$
borrowings
(including current
portion)
2014/12/31
2013/12/31