Experian 2007 Annual Report Download - page 91
Download and view the complete annual report
Please find page 91 of the 2007 Experian annual report below. You can navigate through the pages in the report by either clicking on the pages listed below, or by using the keyword search tool below to find specific information within the annual report.-
 1
1 -
2
-
3
-
4
-
5
-
6
-
7
-
8
-
9
-
10
-
11
-
12
-
13
-
14
-
15
-
16
-
17
-
18
-
19
-
20
-
21
-
22
-
23
-
24
-
25
-
26
-
27
-
28
-
29
-
30
-
31
-
32
-
33
-
34
-
35
-
36
-
37
-
38
-
39
-
40
-
41
-
42
-
43
-
44
-
45
-
46
-
47
-
48
-
49
-
50
-
51
-
52
-
53
-
54
-
55
-
56
-
57
-
58
-
59
-
60
-
61
-
62
-
63
-
64
-
65
-
66
-
67
-
68
-
69
-
70
-
71
-
72
-
73
-
74
-
75
-
76
-
77
-
78
-
79
-
80
-
 81
81 -
 82
82 -
 83
83 -
 84
84 -
 85
85 -
 86
86 -
 87
87 -
 88
88 -
 89
89 -
 90
90 -
 91
91 -
 92
92 -
 93
93 -
 94
94 -
 95
95 -
 96
96 -
 97
97 -
 98
98 -
 99
99 -
 100
100 -
 101
101 -
102
-
103
-
104
-
105
-
106
-
107
-
108
-
109
-
110
-
111
-
112
-
113
-
114
-
115
-
116
-
117
-
118
-
119
-
120
-
121
-
122
-
123
-
124
-
125
-
126
-
127
-
128
-
129
-
130
-
131
-
132
-
133
-
134
-
135
-
136
-
137
-
138
 |
 |

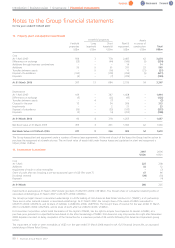
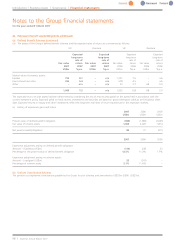
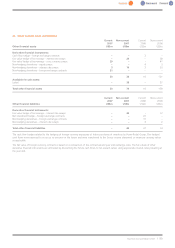
14. Other intangible assets (continued) Internally
Internal use generated Acquisition
Databases software software intangibles* Total
US$m US$m US$m US$m US$m
Cost
At 1 April 2005 516 370 145 130 1,161
Differences on exchange (14) (20) (9) (13) (56)
Additions through business combinations 2 – – 392 394
Other additions 95 70 34 2 201
Transfer between assets – – – 18 18
Disposal of subsidiaries – (27) – – (27)
Disposals (14) (38) (5) – (57)
At 31 March 2006 585 355 165 529 1,634
Amortisation and impairment losses
At 1 April 2005 290 184 76 20 570
Differences on exchange (12) (10) (5) (1) (28)
Charge for the year 88 57 21 66 232
Disposal of subsidiaries – (13) – – (13)
Disposals (13) (38) (2) – (53)
At 31 March 2006 353 180 90 85 708
Net Book Value at 31 March 2005 226 186 69 110 591
Net Book Value at 31 March 2006 232 175 75 444 926
*Acquisition intangibles represents trade marks and licences, trade names, customer relationships and completed technology.
15. Property, plant and equipment Leasehold properties Assets
Freehold Long Short Plant & in course of
properties leasehold leasehold equipment construction Total
US$m US$m US$m US$m US$m US$m
Cost
At 1 April 2006 397 13 684 2,159 54 3,307
Differences on exchange 34 1 51 175 4 265
Additions through business combinations (note 30 (a)) 3 ––1–4
Additions 13 3 32 181 – 229
Transfers between assets – – 22 – (22) –
Demerger of Home Retail Group (note 30 (b)) (160) (17) (666) (1,907) (36) (2,786)
Disposals – – (8) (46) – (54)
At 31 March 2007 287 – 115 563 – 965
Depreciation
At 1 April 2006 60 4 318 1,255 – 1,637
Differences on exchange 3 – 29 100 – 132
Charge for year 8 1 26 178 – 213
Demerger of Home Retail Group (note 30 (b)) (16) (5) (347) (1,119) – (1,487)
Disposals – – (7) (42) – (49)
At 31 March 2007 55 – 19 372 – 446
Net Book Value at 31 March 2006 337 9 366 904 54 1,670
Net Book Value at 31 March 2007 232 – 96 191 – 519
Experian Annual Report2007 |89