Experian 2007 Annual Report Download - page 27
Download and view the complete annual report
Please find page 27 of the 2007 Experian annual report below. You can navigate through the pages in the report by either clicking on the pages listed below, or by using the keyword search tool below to find specific information within the annual report.-
 1
1 -
2
-
3
-
4
-
5
-
6
-
7
-
8
-
9
-
10
-
11
-
12
-
13
-
14
-
15
-
16
-
 17
17 -
 18
18 -
 19
19 -
 20
20 -
 21
21 -
 22
22 -
 23
23 -
 24
24 -
 25
25 -
 26
26 -
 27
27 -
 28
28 -
 29
29 -
 30
30 -
 31
31 -
 32
32 -
 33
33 -
 34
34 -
 35
35 -
 36
36 -
 37
37 -
38
-
39
-
40
-
41
-
42
-
43
-
44
-
45
-
46
-
47
-
48
-
49
-
50
-
51
-
52
-
53
-
54
-
55
-
56
-
57
-
58
-
59
-
60
-
61
-
62
-
63
-
64
-
65
-
66
-
67
-
68
-
69
-
70
-
71
-
72
-
73
-
74
-
75
-
76
-
77
-
78
-
79
-
80
-
81
-
82
-
83
-
84
-
85
-
86
-
87
-
88
-
89
-
90
-
91
-
92
-
93
-
94
-
95
-
96
-
97
-
98
-
99
-
100
-
101
-
102
-
103
-
104
-
105
-
106
-
107
-
108
-
109
-
110
-
111
-
112
-
113
-
114
-
115
-
116
-
117
-
118
-
119
-
120
-
121
-
122
-
123
-
124
-
125
-
126
-
127
-
128
-
129
-
130
-
131
-
132
-
133
-
134
-
135
-
136
-
137
-
138
 |
 |

Interactive
Includes Consumer Direct (online credit reports, scores
and monitoring services) and lead generation businesses:
LowerMyBills (mortgages), PriceGrabber (comparison
shopping) and ClassesUSA (online education)
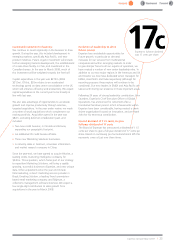
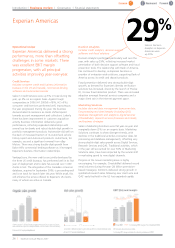
Sales in Interactive grew by 37% during the year,
contributing 38% of total Americas sales from continuing
activities. Organic growth was 20%, with the balance of
17% from acquisitions (mainly PriceGrabber).
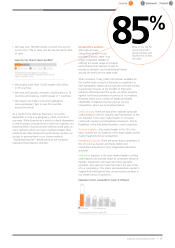
Consumer Direct delivered excellent growth throughout
the period, with strong demand from consumers for
credit monitoring services, which led to higher
membership rates. Meanwhile, increased focus on
enhancing the customer experience resulted in
significantly reduced churn rates. PriceGrabber delivered
very strong growth year-on-year, including a seasonal
boost in December, at which point unique visitors hit
record numbers. In the education vertical, growth at
ClassesUSA accelerated over the year, as it benefited from
shared expertise in online advertising with our other lead
generation properties.
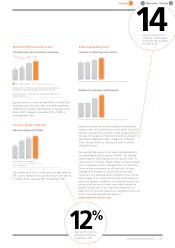
Sales at LowerMyBills were impacted in the final quarter
by the downturn in US sub-prime lending, as lenders
either exited the market or considerably tightened lending
criteria (Q3 sales unchanged, Q4 down 8%). LowerMyBills
traditionally derives some 80% of sales from the sale of
mortgage leads to sub-prime lenders. However, there was
double-digit growth in EBIT in the year as a whole, as
LowerMyBills optimised marketing spend to generate
more profitable leads. In this challenging environment,
LowerMyBills continues to focus on marketing spend
efficiency and is driving sales through sales of higher
quality leads and diversification into both non sub-prime
and non mortgage-related products.
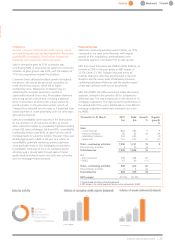
Financial review
Sales from continuing activities were $1,990m, up 15%
compared to the same period last year, with organic
growth of 8%. Acquisitions, predominantly in the
Interactive segment, contributed 7% to sales growth.
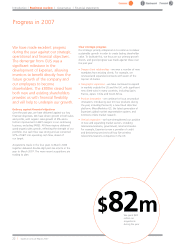
EBIT from direct businesses was $508m (2006: $404m), an
increase of 26% in the year, giving an EBIT margin of
25.5% (2006: 23.3%). Margins improved across all
business segments, reflecting growing scale in Decision
Analytics and the newer areas of Marketing Solutions,
continuing operating efficiencies and the positive impact
of last year’s affiliate credit bureau acquisitions.
EBIT from FARES, the 20%-owned real estate information
associate, reduced in the period to $61m, compared to
$69m last year. This was primarily due to the decline in US
mortgage originations. The improved profit performance in
the second half of the year is attributable to a less difficult
mortgage origination market and continued cost action
by FARES.
Experian Annual Report 2007 | 25
12 months to 31 March 2007 2006 Growth Organic
$m $m % growth
%
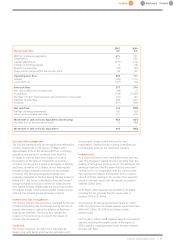
Sales
- Credit Services 804 766 5 3
- Decision Analytics 82 63 29 29
- Marketing Solutions 353 355 - (2)
- Interactive 751 547 37 20
Total – continuing activities 1,990 1,731 15 8
Discontinuing activities14 73 na
Total Americas 1,994 1,804 10
EBIT
- Direct business 508 404 26
- FARES 61 69 (11)
Total – continuing activities 569 473 20
Discontinuing activities1(7) 6 na
Total Americas 562 479 18
EBIT margin225.5% 23.3%
1 Discontinuing activities include MetaReward
2 EBIT margin is for continuing direct business only and excludes FARES