Experian 2007 Annual Report Download - page 81
Download and view the complete annual report
Please find page 81 of the 2007 Experian annual report below. You can navigate through the pages in the report by either clicking on the pages listed below, or by using the keyword search tool below to find specific information within the annual report.-
 1
1 -
2
-
3
-
4
-
5
-
6
-
7
-
8
-
9
-
10
-
11
-
12
-
13
-
14
-
15
-
16
-
17
-
18
-
19
-
20
-
21
-
22
-
23
-
24
-
25
-
26
-
27
-
28
-
29
-
30
-
31
-
32
-
33
-
34
-
35
-
36
-
37
-
38
-
39
-
40
-
41
-
42
-
43
-
44
-
45
-
46
-
47
-
48
-
49
-
50
-
51
-
52
-
53
-
54
-
55
-
56
-
57
-
58
-
59
-
60
-
61
-
62
-
63
-
64
-
65
-
66
-
67
-
68
-
69
-
70
-
 71
71 -
 72
72 -
 73
73 -
 74
74 -
 75
75 -
 76
76 -
 77
77 -
 78
78 -
 79
79 -
 80
80 -
 81
81 -
 82
82 -
 83
83 -
 84
84 -
 85
85 -
 86
86 -
 87
87 -
 88
88 -
 89
89 -
 90
90 -
 91
91 -
92
-
93
-
94
-
95
-
96
-
97
-
98
-
99
-
100
-
101
-
102
-
103
-
104
-
105
-
106
-
107
-
108
-
109
-
110
-
111
-
112
-
113
-
114
-
115
-
116
-
117
-
118
-
119
-
120
-
121
-
122
-
123
-
124
-
125
-
126
-
127
-
128
-
129
-
130
-
131
-
132
-
133
-
134
-
135
-
136
-
137
-
138
 |
 |

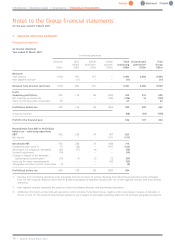
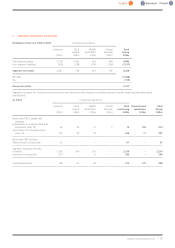
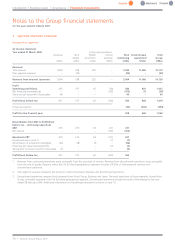
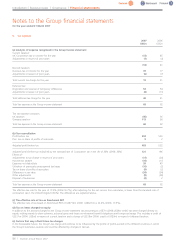
3. Segmental information (continued)
Year ended 31 March 2006 Continuing operations
Credit Decision Marketing Central Total Discontinued Total
Services Analytics Solutions Interactive activities continuing operations3Group
US$m US$m US$m US$m US$m US$m US$m US$m
Revenue1
Total revenue 1,504 325 627 628 – 3,084 11,086 14,170
Inter-segment revenue2(20) – – – – (20) – (20)
Revenue from external customers 1,484 325 627 628 – 3,064 11,086 14,150
Profit
Operating profit/(loss) 395 102 41 86 (38) 586 835 1,421
Net financing income/(costs) – – – – (102) (102) 33 (69)
Share of post-tax profits of associates 66 – – – – 66 – 66
Profit/(loss) before tax 461 102 41 86 (140) 550 868 1,418
Group tax expense (92) (262) (354)
Profit for the financial year 458 606 1,064
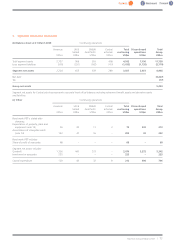
Reconciliation from EBIT
to Profit/(loss) beforetax –
continuing operations
EBIT 477 102 57 122 (31) 727
Net interest – – – – (100) (100)
Benchmark PBT 477 102 57 122 (131) 627
Exceptional items (note 7) – – – – (7) (7)
Amortisation of acquisition
intangibles (14) – (16) (36) – (66)
Financing fair value
remeasurements – – – – (2) (2)
Tax expense on shareof profit
of associates (2) – – – – (2)
Profit/(loss) beforetax 461 102 41 86 (140) 550
1. Revenue from continuing operations arose principally from the provision of services. Revenue from discontinued operations arose principally
from the sale of goods. Revenue from Credit Services includes US$20m of inter-segment revenue with discontinued operations.
2. Inter-segment revenue represents the provision of services between Experian and discontinued operations.
3. Discontinued operations comprise the businesses Home Retail Group, Burberry and Lewis which were all individual segments. Discontinued
operations include the results of Homebase for the year ended 28 February 2006. Additional information on discontinued operations is given in
note 10.
Experian Annual Report2007 |79