Experian 2007 Annual Report Download - page 82
Download and view the complete annual report
Please find page 82 of the 2007 Experian annual report below. You can navigate through the pages in the report by either clicking on the pages listed below, or by using the keyword search tool below to find specific information within the annual report.-
 1
1 -
2
-
3
-
4
-
5
-
6
-
7
-
8
-
9
-
10
-
11
-
12
-
13
-
14
-
15
-
16
-
17
-
18
-
19
-
20
-
21
-
22
-
23
-
24
-
25
-
26
-
27
-
28
-
29
-
30
-
31
-
32
-
33
-
34
-
35
-
36
-
37
-
38
-
39
-
40
-
41
-
42
-
43
-
44
-
45
-
46
-
47
-
48
-
49
-
50
-
51
-
52
-
53
-
54
-
55
-
56
-
57
-
58
-
59
-
60
-
61
-
62
-
63
-
64
-
65
-
66
-
67
-
68
-
69
-
70
-
71
-
 72
72 -
 73
73 -
 74
74 -
 75
75 -
 76
76 -
 77
77 -
 78
78 -
 79
79 -
 80
80 -
 81
81 -
 82
82 -
 83
83 -
 84
84 -
 85
85 -
 86
86 -
 87
87 -
 88
88 -
 89
89 -
 90
90 -
 91
91 -
 92
92 -
93
-
94
-
95
-
96
-
97
-
98
-
99
-
100
-
101
-
102
-
103
-
104
-
105
-
106
-
107
-
108
-
109
-
110
-
111
-
112
-
113
-
114
-
115
-
116
-
117
-
118
-
119
-
120
-
121
-
122
-
123
-
124
-
125
-
126
-
127
-
128
-
129
-
130
-
131
-
132
-
133
-
134
-
135
-
136
-
137
-
138
 |
 |

Introduction | Business review | Governance | Financial statements
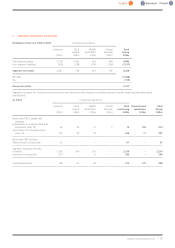
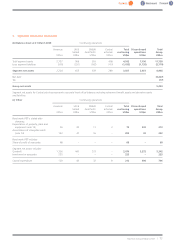
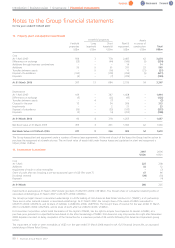
3. Segmental information (continued)
2007 2006
(b) Total segment assets US$m US$m
Continuing operations
Credit Services 1,871 1,652
Decision Analytics 293 242
Marketing Solutions 993 893
Interactive 1,131 1,174
Central activities 558 581
Total continuing operations 4,846 4,542
Discontinued operations –7,196
Total 4,846 11,738
Total segment assets for Central activities at 31 March 2007 represents corporate head office balances including retirement benefit and derivative
assets. In addition to those assets reflected in the geographical analysis, all Group properties are included within Central activities as they are not
allocated by business segment.
2007 2006
(c) Capital expenditure US$m US$m
Continuing operations
Credit Services 182 132
Decision Analytics 911
Marketing Solutions 64 48
Interactive 20 13
Central activities –8
Total continuing operations 275 212
Discontinued operations 173 494
Total 448 706
4. Foreign currency
The principal exchange rates used wereas follows:
Average Closing
2007 2006 2007 2006 2005
Sterling to US Dollar 1.89 1.79 1.96 1.74 1.88
Euroto US Dollar 1.29 1.22 1.33 1.22 1.30
Assets and liabilities of undertakings whose functional currency is not the US Dollar are translated into US Dollars at the rates of exchange ruling at
the balance sheet date and the income statement is translated into US Dollars at average rates of exchange (unless this average is not a reasonable
approximation of the cumulative effect of the rates prevailing on the transaction dates, in which case income and expenses are translated at the
rates on the dates of the transactions).
Notes to the Group financial statements
for the year ended 31 March 2007
80 |Experian Annual Report2007