Experian 2007 Annual Report Download - page 106
Download and view the complete annual report
Please find page 106 of the 2007 Experian annual report below. You can navigate through the pages in the report by either clicking on the pages listed below, or by using the keyword search tool below to find specific information within the annual report.-
 1
1 -
2
-
3
-
4
-
5
-
6
-
7
-
8
-
9
-
10
-
11
-
12
-
13
-
14
-
15
-
16
-
17
-
18
-
19
-
20
-
21
-
22
-
23
-
24
-
25
-
26
-
27
-
28
-
29
-
30
-
31
-
32
-
33
-
34
-
35
-
36
-
37
-
38
-
39
-
40
-
41
-
42
-
43
-
44
-
45
-
46
-
47
-
48
-
49
-
50
-
51
-
52
-
53
-
54
-
55
-
56
-
57
-
58
-
59
-
60
-
61
-
62
-
63
-
64
-
65
-
66
-
67
-
68
-
69
-
70
-
71
-
72
-
73
-
74
-
75
-
76
-
77
-
78
-
79
-
80
-
81
-
82
-
83
-
84
-
85
-
86
-
87
-
88
-
89
-
90
-
91
-
92
-
93
-
94
-
95
-
 96
96 -
 97
97 -
 98
98 -
 99
99 -
 100
100 -
 101
101 -
 102
102 -
 103
103 -
 104
104 -
 105
105 -
 106
106 -
 107
107 -
 108
108 -
 109
109 -
 110
110 -
 111
111 -
 112
112 -
 113
113 -
 114
114 -
 115
115 -
 116
116 -
117
-
118
-
119
-
120
-
121
-
122
-
123
-
124
-
125
-
126
-
127
-
128
-
129
-
130
-
131
-
132
-
133
-
134
-
135
-
136
-
137
-
138
 |
 |

Introduction | Business review | Governance | Financial statements
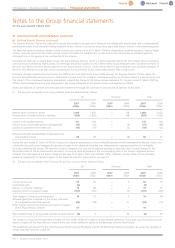
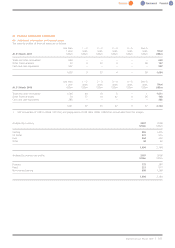
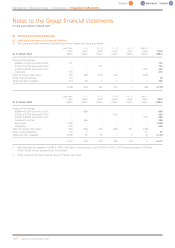
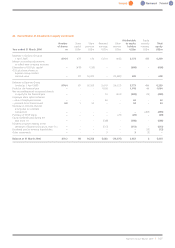
26 Financial instruments (continued)
(c) Additional information on financial liabilities (continued)
(iv) Analysis of financial liabilities by maturity profile:
Less than 1 – 2 2 – 3 3 – 4 4 – 5 Over 5
1year years years years years years Total
At 31 March 2007 US$m US$m US$m US$m US$m US$m US$m
Loans and Borrowings 1,024 – 721 – – 627 2,372
Other financial liabilities – – – – – 40 40
Trade and other payables1714 46 3 1 1 1 766
1,738 46 724 1 1 668 3,178
Less than 1 – 2 2 – 3 3 – 4 4 – 5 Over 5
1year years years years years years Total
At 31 March 2006 US$m US$m US$m US$m US$m US$m US$m
Loans and Borrowings 295 1,736 646 620 – 595 3,892
Other financial liabilities 372–––1251
Trade and other payables12,038 55 30 – 3 8 2,134
2,370 1,793 676 620 3 615 6,077
1. VAT and other tax payable of US$42m (2006: US$125m), social security costs of US$75m (2006: US$75m) and accruals of US$200m
(2006: US$231m) are excluded from this analysis.
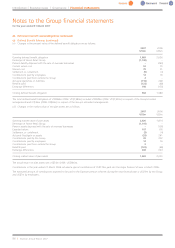
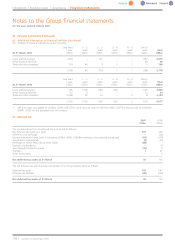
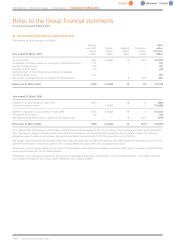
27. Deferred tax
2007 2006
US$m US$m
The movements on the net deferred tax account are as follows:
Net deferred tax assets at 1 April 197 335
Differences on exchange –(22)
Income statement charge (note 9) (including US$5m (2006: US$68m) relating to discontinued operations) (54) (109)
Acquisition of subsidiaries (2) (39)
Demerger of Home Retail Group (note 30(b)) (89) –
Disposal of subsidiaries –(7)
Tax (charged)/credited to equity (18) 9
Transfers 125
Other movements –5
Net deferred tax assets at 31 March 35 197
The net deferred tax asset has been presented in the Group balance sheet as follows:
Deferred tax asset 103 547
Deferred tax liabilities (68) (350)
Net deferred tax assets at 31 March 35 197
Notes to the Group financial statements
for the year ended 31 March 2007
104 |Experian Annual Report2007