Experian 2007 Annual Report Download - page 100
Download and view the complete annual report
Please find page 100 of the 2007 Experian annual report below. You can navigate through the pages in the report by either clicking on the pages listed below, or by using the keyword search tool below to find specific information within the annual report.-
 1
1 -
2
-
3
-
4
-
5
-
6
-
7
-
8
-
9
-
10
-
11
-
12
-
13
-
14
-
15
-
16
-
17
-
18
-
19
-
20
-
21
-
22
-
23
-
24
-
25
-
26
-
27
-
28
-
29
-
30
-
31
-
32
-
33
-
34
-
35
-
36
-
37
-
38
-
39
-
40
-
41
-
42
-
43
-
44
-
45
-
46
-
47
-
48
-
49
-
50
-
51
-
52
-
53
-
54
-
55
-
56
-
57
-
58
-
59
-
60
-
61
-
62
-
63
-
64
-
65
-
66
-
67
-
68
-
69
-
70
-
71
-
72
-
73
-
74
-
75
-
76
-
77
-
78
-
79
-
80
-
81
-
82
-
83
-
84
-
85
-
86
-
87
-
88
-
89
-
 90
90 -
 91
91 -
 92
92 -
 93
93 -
 94
94 -
 95
95 -
 96
96 -
 97
97 -
 98
98 -
 99
99 -
 100
100 -
 101
101 -
 102
102 -
 103
103 -
 104
104 -
 105
105 -
 106
106 -
 107
107 -
 108
108 -
 109
109 -
 110
110 -
111
-
112
-
113
-
114
-
115
-
116
-
117
-
118
-
119
-
120
-
121
-
122
-
123
-
124
-
125
-
126
-
127
-
128
-
129
-
130
-
131
-
132
-
133
-
134
-
135
-
136
-
137
-
138
 |
 |

Introduction | Business review | Governance | Financial statements
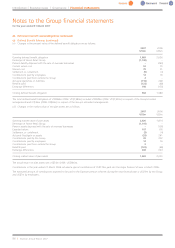
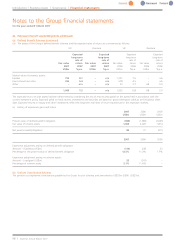
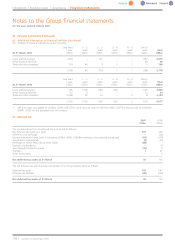
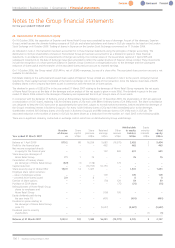
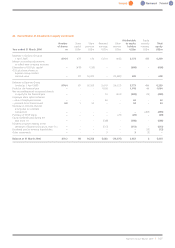
24. Retirement benefit assets/obligations (continued)
(a) Defined Benefit Schemes (continued)
(ix) The assets of the Group’s defined benefit schemes and the expected rates of return are summarised as follows:
UK Overseas UK Overseas
Expected Expected Expected Expected
long-term long-term long-term long-term
rate of rate of rate of rate of
Fair value return Fair value return Fair value return Fair value return
2007 2007 2007 2007 2006 2006 2006 2006
US$m %p.a. US$m %p.a. US$m %p.a. US$m %p.a.
Market value of schemes’ assets:
Equities 733 8.1 – n/a 1,351 7.9 – n/a
Fixed interest securities 336 5.4 – n/a 578 4.5 – n/a
Other – n/a – n/a 23 3.7 68 5.0
1,069 7.3 – n/a 1,952 6.8 68 5.0
The expected return on plan assets has been determined by considering the mix of returns anticipated on the assets held in accordance with the
current investment policy. Expected yields on fixed interest investments and securities are based on gross redemption yields as at the balance sheet
date. Expected returns on equity and other investments reflect the long-term real rates of return experienced in the respective markets.
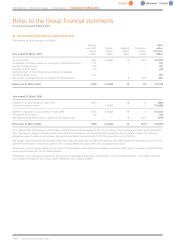
(x) History of experience gains and losses:
2007 2006 2005
US$m US$m US$m
Present value of defined benefit obligation (984) (1,989) (2,025)
Fair value of scheme assets 1,069 2,020 1,814
Net pension asset/(obligation) 85 31 (211)
2007 2006 2005
Experience adjustment arising on defined benefit obligation:
Amount – (Gain)/loss (US$m) (119) 228 33
Percentage of the present value of defined benefit obligation 12.5% 11.2% 1.7%
Experience adjustment arising on scheme assets:
Amount – Loss/(gain) (US$m) 53 (241) –
Percentage of scheme assets 5.1% 11.6% –
(b) Defined Contribution Schemes
The pension cost represents contributions payable by the Group to such schemes and amounted to US$33m (2006: US$27m).
Notes to the Group financial statements
for the year ended 31 March 2007
98 |Experian Annual Report2007