Experian 2007 Annual Report Download - page 65
Download and view the complete annual report
Please find page 65 of the 2007 Experian annual report below. You can navigate through the pages in the report by either clicking on the pages listed below, or by using the keyword search tool below to find specific information within the annual report.-
 1
1 -
2
-
3
-
4
-
5
-
6
-
7
-
8
-
9
-
10
-
11
-
12
-
13
-
14
-
15
-
16
-
17
-
18
-
19
-
20
-
21
-
22
-
23
-
24
-
25
-
26
-
27
-
28
-
29
-
30
-
31
-
32
-
33
-
34
-
35
-
36
-
37
-
38
-
39
-
40
-
41
-
42
-
43
-
44
-
45
-
46
-
47
-
48
-
49
-
50
-
51
-
52
-
53
-
54
-
 55
55 -
 56
56 -
 57
57 -
 58
58 -
 59
59 -
 60
60 -
 61
61 -
 62
62 -
 63
63 -
 64
64 -
 65
65 -
 66
66 -
 67
67 -
 68
68 -
 69
69 -
 70
70 -
 71
71 -
 72
72 -
 73
73 -
 74
74 -
 75
75 -
76
-
77
-
78
-
79
-
80
-
81
-
82
-
83
-
84
-
85
-
86
-
87
-
88
-
89
-
90
-
91
-
92
-
93
-
94
-
95
-
96
-
97
-
98
-
99
-
100
-
101
-
102
-
103
-
104
-
105
-
106
-
107
-
108
-
109
-
110
-
111
-
112
-
113
-
114
-
115
-
116
-
117
-
118
-
119
-
120
-
121
-
122
-
123
-
124
-
125
-
126
-
127
-
128
-
129
-
130
-
131
-
132
-
133
-
134
-
135
-
136
-
137
-
138
 |
 |

2007 2006
(Represented)
(Note 2)
Notes US$m US$m
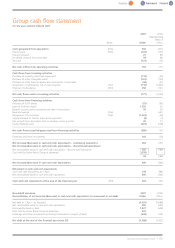
Cash generated from operations 29(a) 942 874
Interest paid 29(b) (133) (179)
Interest received 27 68
Dividends received from associates 39 48
Tax paid (121) (32)
Net cash inflow from operating activities 754 779
Cash flows from investing activities
Purchase of property, plant and equipment (114) (62)
Purchase of other intangible assets (161) (150)
Purchase of other financial assets and investments in associates (42) (41)
Acquisition of subsidiaries, net of cash acquired 29(c) (118) (1,420)
Disposal of subsidiaries 29(d) 258 643
Net cash flows used in investing activities (177) (1,030)
Cash flows from financing activities
Purchase of ESOP shares (75) (65)
Issue of Ordinaryshares 1,525 52
Receipt of shareoption proceeds and sale of own shares 59 36
New borrowings 29(e) –647
Repayment of borrowings 29(e) (1,423) (63)
Capital element of finance lease rental payments (4) (2)
Net receipts from derivatives held to manage currency profile 39 13
Equity dividends paid (401) (508)
Net cash flows (used in)/generated from financing activities (280) 110
Exchange and other movements 166 (20)
Net increase/(decrease) in cash and cash equivalents – continuing operations 463 (161)
Net increase/(decrease) in cash and cash equivalents – discontinued operations:
Net increase/(decrease) in cash and cash equivalents – discontinued operations 550 (188)
Cash held by Home Retail Group at demerger (518) –
32 (188)
Net increase/(decrease) in cash and cash equivalents 495 (349)
Movement in cash and cash equivalents
Cash and cash equivalents at 1 April 139 488
Net increase/(decrease) in cash and cash equivalents 495 (349)
Cash and cash equivalents at the end of the financial year 29(f) 634 139
Non-GAAP measures 2007 2006
Reconciliation of net increase/(decrease) in cash and cash equivalents to movement in net debt US$m US$m
Net debt at 1 April – as reported (3,437) (2,688)
Net increase/(decrease) in cash and cash equivalents 495 (349)
Decrease/(Increase) in debt 1,427 (658)
Debt held by Home Retail Group at demerger 435 –
Exchange and other movements (including movements in respect of debt) (328) 258
Net debt at the end of the financial year (note 22) (1,408) (3,437)
Group cash flow statement
for the year ended 31 March 2007
Experian Annual Report2007 |63