Experian 2007 Annual Report Download - page 35
Download and view the complete annual report
Please find page 35 of the 2007 Experian annual report below. You can navigate through the pages in the report by either clicking on the pages listed below, or by using the keyword search tool below to find specific information within the annual report.-
 1
1 -
2
-
3
-
4
-
5
-
6
-
7
-
8
-
9
-
10
-
11
-
12
-
13
-
14
-
15
-
16
-
17
-
18
-
19
-
20
-
21
-
22
-
23
-
24
-
 25
25 -
 26
26 -
 27
27 -
 28
28 -
 29
29 -
 30
30 -
 31
31 -
 32
32 -
 33
33 -
 34
34 -
 35
35 -
 36
36 -
 37
37 -
 38
38 -
 39
39 -
 40
40 -
 41
41 -
 42
42 -
 43
43 -
 44
44 -
 45
45 -
46
-
47
-
48
-
49
-
50
-
51
-
52
-
53
-
54
-
55
-
56
-
57
-
58
-
59
-
60
-
61
-
62
-
63
-
64
-
65
-
66
-
67
-
68
-
69
-
70
-
71
-
72
-
73
-
74
-
75
-
76
-
77
-
78
-
79
-
80
-
81
-
82
-
83
-
84
-
85
-
86
-
87
-
88
-
89
-
90
-
91
-
92
-
93
-
94
-
95
-
96
-
97
-
98
-
99
-
100
-
101
-
102
-
103
-
104
-
105
-
106
-
107
-
108
-
109
-
110
-
111
-
112
-
113
-
114
-
115
-
116
-
117
-
118
-
119
-
120
-
121
-
122
-
123
-
124
-
125
-
126
-
127
-
128
-
129
-
130
-
131
-
132
-
133
-
134
-
135
-
136
-
137
-
138
 |
 |

Experian Annual Report 2007 |33
Use of non-GAAP measures
Experian has identified certain measures that it believes
provide additional useful information on the performance
of the Group. As the measures are not defined under
IFRS they may not be directly comparable with other
companies‘ adjusted measures. The non-GAAP measures
are not intended to be a substitute for, or superior to,
any IFRS measures of performance. Certain non-GAAP
measures identified by the Group are shown in note 2 to
the financial statements. Further non-GAAP measures
and reconciliations of those measures are set out below.
Discontinuing activities: Experian defines discontinuing
activities as businesses sold, closed or identified for
closure during a financial year. These are treated as
discontinuing activities for both sales and EBIT purposes.
Prior periods, where shown, are restated to exclude the
results on discontinuing activities. This financial measure
differs from the definition of discontinued operations set
out in IFRS 5 ‘Non-current assets held for sale and
discontinued operations’. Under IFRS 5, a discontinued
operation is: (i) a separate major line of business or
geographical area of operations; (ii) part of a single plan
to dispose of a major line of business or geographical
area of operations; or (iii) a subsidiary acquired exclusively
with a view to resale.
Continuing activities: Businesses trading at 31 March
2007 that have not been disclosed as discontinuing
activities are treated as continuing activities.
Organic growth: This is the year-on-year change in
continuing activities sales, at constant exchange rates,
excluding acquisitions (other than affiliate credit bureaux)
until the first anniversary date of consolidation.
Direct business: Direct business refers to Experian’s
business exclusive of financial results of FARES.
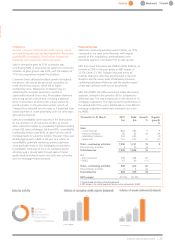
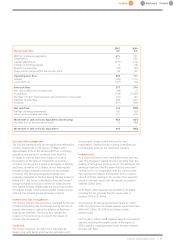
Reconciliation of sales and EBIT by geography
12 months to 31 March 2007 2006
Continuing Discontinuing Total Continuing Discontinuing Total
activities activities activities activities
$m $m $m $m $m $m
Sales
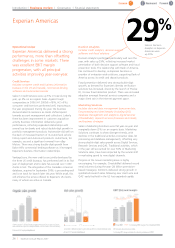
Americas 1,990 4 1,994 1,731 73 1,804
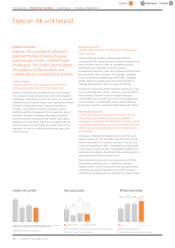
UK & Ireland 843 64 907 677 81 758
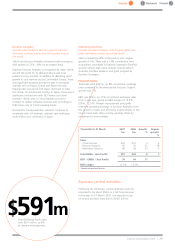
EMEA/Asia Pacific 591 - 591 522 - 522
Total sales 3,424 68 3,492 2,930 154 3,084
EBIT
Americas – direct business 508 (7) 501 404 6 410
FARES 61 - 61 69 - 69
Total Americas 569 (7) 562 473 6 479
UK & Ireland 221 24 245 179 36 215
UK & Ireland restructuring charge (8) - (8) - - -
EMEA/Asia Pacific 74 - 74 64 - 64
Central activities (47) - (47) (31) - (31)
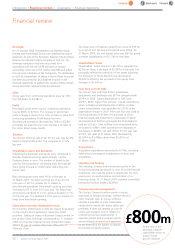
Total EBIT 808 17 825 685 42 727
Net interest (111) (100)
Benchmark PBT 714 627
Exceptional items (162) (7)
Amortisation of acquisition intangibles (76) (66)
Goodwill adjustment (14) -
Charges for demerger-related equity incentive plans (24) -
Financing fair value remeasurements (35) (2)
Tax expense of associates (9) (2)
Profit before tax 394 550