Experian 2007 Annual Report Download - page 63
Download and view the complete annual report
Please find page 63 of the 2007 Experian annual report below. You can navigate through the pages in the report by either clicking on the pages listed below, or by using the keyword search tool below to find specific information within the annual report.-
 1
1 -
2
-
3
-
4
-
5
-
6
-
7
-
8
-
9
-
10
-
11
-
12
-
13
-
14
-
15
-
16
-
17
-
18
-
19
-
20
-
21
-
22
-
23
-
24
-
25
-
26
-
27
-
28
-
29
-
30
-
31
-
32
-
33
-
34
-
35
-
36
-
37
-
38
-
39
-
40
-
41
-
42
-
43
-
44
-
45
-
46
-
47
-
48
-
49
-
50
-
51
-
52
-
 53
53 -
 54
54 -
 55
55 -
 56
56 -
 57
57 -
 58
58 -
 59
59 -
 60
60 -
 61
61 -
 62
62 -
 63
63 -
 64
64 -
 65
65 -
 66
66 -
 67
67 -
 68
68 -
 69
69 -
 70
70 -
 71
71 -
 72
72 -
 73
73 -
74
-
75
-
76
-
77
-
78
-
79
-
80
-
81
-
82
-
83
-
84
-
85
-
86
-
87
-
88
-
89
-
90
-
91
-
92
-
93
-
94
-
95
-
96
-
97
-
98
-
99
-
100
-
101
-
102
-
103
-
104
-
105
-
106
-
107
-
108
-
109
-
110
-
111
-
112
-
113
-
114
-
115
-
116
-
117
-
118
-
119
-
120
-
121
-
122
-
123
-
124
-
125
-
126
-
127
-
128
-
129
-
130
-
131
-
132
-
133
-
134
-
135
-
136
-
137
-
138
 |
 |

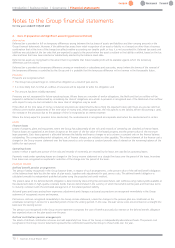
2007 2006
(Represented)
(Note 2)
Notes US$m US$m
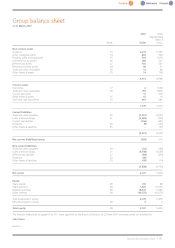
Non-current assets
Goodwill 13 2,219 5,342
Other intangible assets 14 804 926
Property, plant and equipment 15 519 1,670
Investment in associates 16 286 225
Deferred tax assets 27 103 547
Retirement benefit assets 24 85 31
Trade and other receivables 18 11 89
Other financial assets 25 74 158
4,101 8,988
Current assets
Inventories 17 41,538
Trade and other receivables 18 794 1,830
Current tax assets 17 207
Other financial assets 25 53 10
Cash and cash equivalents 19 907 385
1,775 3,970
Current liabilities
Trade and other payables 20 (1,031) (2,421)
Loans and borrowings 21 (1,025) (303)
Current tax liabilities (166) (481)
Provisions 23 (9) (155)
Other financial liabilities 25 –(37)
(2,231) (3,397)
Net current (liabilities)/assets (456) 573
Non-current liabilities
Trade and other payables 20 (52) (144)
Loans and borrowings 21 (1,348) (3,599)
Deferred tax liabilities 27 (68) (350)
Provisions 23 (30) –
Other financial liabilities 25 (40) (14)
(1,538) (4,107)
Net assets 2,107 5,454
Equity
Share capital 28 102 88
Share premium 28 1,435 16,256
Retained earnings 28 16,341 5,683
Other reserves 28 (15,773) (16,575)
Total shareholders’ equity 2,105 5,452
Minority interests in equity 28 22
Total equity 28 2,107 5,454
The financial statements on pages 60 to 119 were approved by the Board of Directors on 22 May 2007 and were signed on its behalf by:
John Peace
Director
Group balance sheet
at 31 March 2007
Experian Annual Report2007 |61