Experian 2007 Annual Report Download - page 109
Download and view the complete annual report
Please find page 109 of the 2007 Experian annual report below. You can navigate through the pages in the report by either clicking on the pages listed below, or by using the keyword search tool below to find specific information within the annual report.-
 1
1 -
2
-
3
-
4
-
5
-
6
-
7
-
8
-
9
-
10
-
11
-
12
-
13
-
14
-
15
-
16
-
17
-
18
-
19
-
20
-
21
-
22
-
23
-
24
-
25
-
26
-
27
-
28
-
29
-
30
-
31
-
32
-
33
-
34
-
35
-
36
-
37
-
38
-
39
-
40
-
41
-
42
-
43
-
44
-
45
-
46
-
47
-
48
-
49
-
50
-
51
-
52
-
53
-
54
-
55
-
56
-
57
-
58
-
59
-
60
-
61
-
62
-
63
-
64
-
65
-
66
-
67
-
68
-
69
-
70
-
71
-
72
-
73
-
74
-
75
-
76
-
77
-
78
-
79
-
80
-
81
-
82
-
83
-
84
-
85
-
86
-
87
-
88
-
89
-
90
-
91
-
92
-
93
-
94
-
95
-
96
-
97
-
98
-
 99
99 -
 100
100 -
 101
101 -
 102
102 -
 103
103 -
 104
104 -
 105
105 -
 106
106 -
 107
107 -
 108
108 -
 109
109 -
 110
110 -
 111
111 -
 112
112 -
 113
113 -
 114
114 -
 115
115 -
 116
116 -
 117
117 -
 118
118 -
 119
119 -
120
-
121
-
122
-
123
-
124
-
125
-
126
-
127
-
128
-
129
-
130
-
131
-
132
-
133
-
134
-
135
-
136
-
137
-
138
 |
 |

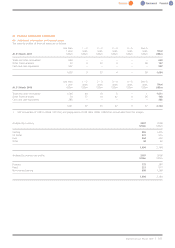
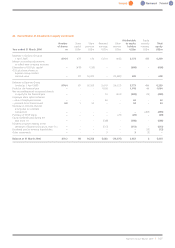
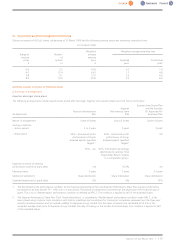
28. Reconciliation of movements in equity (continued)
Attributable Equity
Number Share Share Retained Other to equity minority Total
of shares capital premium earnings reserves holders interests equity
Year ended 31 March 2006 m US$m US$m US$m US$m US$m US$m US$m
Balances in GUS plc Group at
1April 2005 874.4 478 130 5,610 (445) 5,773 486 6,259
Merger accounting adjustments
to reflect new company structure:
Elimination of GUS plc capital –(478) (130) – – (608) –(608)
GUS plc shares shown at
Experian Group Limited
nominal value –87 16,203 – (15,682) 608 –608
Balances in Experian Group
Limited at 1 April 2005 874.4 87 16,203 5,610 (16,127) 5,773 486 6,259
Profit for the financial year –– – 1,018 – 1,018 46 1,064
Net income/(expense) recognised directly
in equity for the financial year –– – 10 (419) (409) (19) (428)
Employee share option schemes:
–value of employee services –––63–63 –63
–proceeds from shares issued 4.8 153 – – 54 –54
Decrease in minority interests
arising due to corporate
transactions ––––– –(495) (495)
Purchase of ESOP shares –– – – (29) (29) –(29)
Equity dividends paid during the
year (note 11) –– – (508) – (508) –(508)
Dividend in specie relating to the
demerger of Burberry Group plc (note 11) –– – (513) – (513) –(513)
Dividends paid to minority shareholders ––––– –(13) (13)
Other movements –––3– 3(3) –
Balance at 31 March 2006 879.2 88 16,256 5,683 (16,575) 5,452 2 5,454
Experian Annual Report2007 |107