Experian 2007 Annual Report Download - page 36
Download and view the complete annual report
Please find page 36 of the 2007 Experian annual report below. You can navigate through the pages in the report by either clicking on the pages listed below, or by using the keyword search tool below to find specific information within the annual report.-
 1
1 -
2
-
3
-
4
-
5
-
6
-
7
-
8
-
9
-
10
-
11
-
12
-
13
-
14
-
15
-
16
-
17
-
18
-
19
-
20
-
21
-
22
-
23
-
24
-
25
-
 26
26 -
 27
27 -
 28
28 -
 29
29 -
 30
30 -
 31
31 -
 32
32 -
 33
33 -
 34
34 -
 35
35 -
 36
36 -
 37
37 -
 38
38 -
 39
39 -
 40
40 -
 41
41 -
 42
42 -
 43
43 -
 44
44 -
 45
45 -
 46
46 -
47
-
48
-
49
-
50
-
51
-
52
-
53
-
54
-
55
-
56
-
57
-
58
-
59
-
60
-
61
-
62
-
63
-
64
-
65
-
66
-
67
-
68
-
69
-
70
-
71
-
72
-
73
-
74
-
75
-
76
-
77
-
78
-
79
-
80
-
81
-
82
-
83
-
84
-
85
-
86
-
87
-
88
-
89
-
90
-
91
-
92
-
93
-
94
-
95
-
96
-
97
-
98
-
99
-
100
-
101
-
102
-
103
-
104
-
105
-
106
-
107
-
108
-
109
-
110
-
111
-
112
-
113
-
114
-
115
-
116
-
117
-
118
-
119
-
120
-
121
-
122
-
123
-
124
-
125
-
126
-
127
-
128
-
129
-
130
-
131
-
132
-
133
-
134
-
135
-
136
-
137
-
138
 |
 |

34 |Experian Annual Report 2007
Financial review cont.
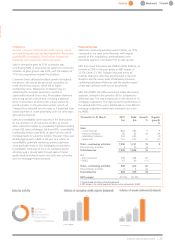
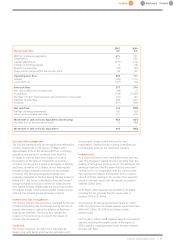
Reconciliation of sales and EBIT by business segment
12 months to 31 March 2007 2006 Total Organic
$m $m growth4growth4
Sales
Credit Services 1,520 1,420 4% 3%
Decision Analytics 392 325 16% 15%
Marketing Solutions 728 627 13% -
Interactive 784 558 40% 23%
Total – continuing activities 3,424 2,930 14% 8%
Discontinuing activities168 154 na
Total 3,492 3,084 11%
EBIT
Credit Services
Direct business 420 371 11%
FARES 61 69 (11%)
Total Credit Services 482 440 8%
Decision Analytics 136 102 27%
Marketing Solutions 73 57 24%
Restructuring charge (8) - na
Total Marketing Solutions 65 57 10%
Interactive 173 117 50%
Central activities (47) (31) na
Total – continuing activities 808 685 16%
Discontinuing activities117 42 na
Total 825 727 11%
EBIT margin
Credit Services – direct business 27.6% 26.1%
Decision Analytics 34.7% 31.5%
Marketing Solutions210.0% 9.1%
Interactive 22.1% 21.0%
Total EBIT margin321.8% 21.0%
1 Discontinuing activities include MetaReward and UK account processing
2 Total EBIT margin for continuing direct business only, excludes FARES, includes restructuring charge and central activities
3 EBIT margin is for continuing direct business only, excluding FARES
4 Growth at constant FX rates
Basis of preparation for pro forma
interest calculations
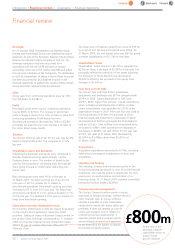
Equity proceeds
At demerger Experian raised £800m of new equity. For
the purposes of preparing pro forma results, net interest
has been calculated to illustrate the impact on Group
financial performance as if this equity had been issued at
1 April 2006. The financial impact of this is a credit to
interest of $37m.
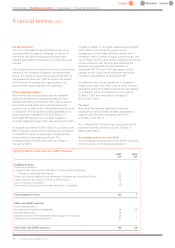
Management of bank balances
In the period prior to demerger, bank balances were
managed centrally on a pooled basis in accordance with
the normal treasury arrangements in groups of
companies. Home Retail Group companies held bank
balances in the pool and interest thereon is reported
within discontinued activities. Experian will continue to
use pooling arrangements but the arrangements prior to
demerger result in an increase in the reported interest
cost for the year for continuing operations of $9m.
Introduction | Business review | Governance | Financial statements