Experian 2007 Annual Report Download - page 104
Download and view the complete annual report
Please find page 104 of the 2007 Experian annual report below. You can navigate through the pages in the report by either clicking on the pages listed below, or by using the keyword search tool below to find specific information within the annual report.-
 1
1 -
2
-
3
-
4
-
5
-
6
-
7
-
8
-
9
-
10
-
11
-
12
-
13
-
14
-
15
-
16
-
17
-
18
-
19
-
20
-
21
-
22
-
23
-
24
-
25
-
26
-
27
-
28
-
29
-
30
-
31
-
32
-
33
-
34
-
35
-
36
-
37
-
38
-
39
-
40
-
41
-
42
-
43
-
44
-
45
-
46
-
47
-
48
-
49
-
50
-
51
-
52
-
53
-
54
-
55
-
56
-
57
-
58
-
59
-
60
-
61
-
62
-
63
-
64
-
65
-
66
-
67
-
68
-
69
-
70
-
71
-
72
-
73
-
74
-
75
-
76
-
77
-
78
-
79
-
80
-
81
-
82
-
83
-
84
-
85
-
86
-
87
-
88
-
89
-
90
-
91
-
92
-
93
-
 94
94 -
 95
95 -
 96
96 -
 97
97 -
 98
98 -
 99
99 -
 100
100 -
 101
101 -
 102
102 -
 103
103 -
 104
104 -
 105
105 -
 106
106 -
 107
107 -
 108
108 -
 109
109 -
 110
110 -
 111
111 -
 112
112 -
 113
113 -
 114
114 -
115
-
116
-
117
-
118
-
119
-
120
-
121
-
122
-
123
-
124
-
125
-
126
-
127
-
128
-
129
-
130
-
131
-
132
-
133
-
134
-
135
-
136
-
137
-
138
 |
 |

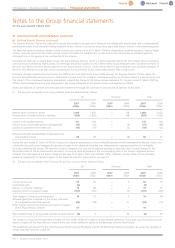
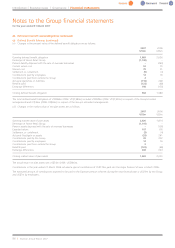
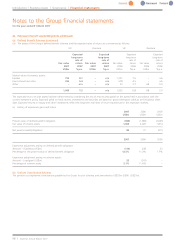
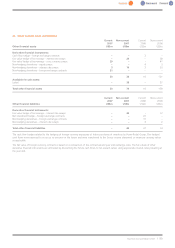
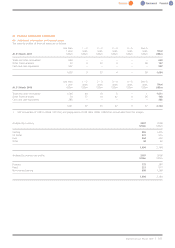
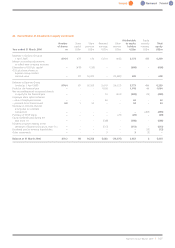
26 Financial instruments (continued)
(c) Additional information on financial liabilities
(i) The contractual repricing dates of liabilities exposed to interest rate risk are as follows:
Less than 1 – 2 2 – 3 3 – 4 4 – 5 Over 5
1year years years years years years Total
At 31 March 2007 US$m US$m US$m US$m US$m US$m US$m
Loans and Borrowings
€548m 4.125% Euronotes 2007 751 – – – – – 751
£350m 6.375% Eurobonds 2009 – – 721 – – – 721
£334m 5.625% Euronotes 2013 – – – – – 627 627
Overdrafts 273 – – – – – 273
Effect of interest rate swaps2130 408 (272) 390 – (656) –
Other financial liabilities 40 – – – – – 40
Trade and other payables1714 46 3 1 1 1 766
1,908 454 452 391 1 (28) 3,178
Less than 1 – 2 2 – 3 3 – 4 4 – 5 Over 5
1year years years years years years Total
At 31 March 2006 US$m US$m US$m US$m US$m US$m US$m
Loans and Borrowings
€568m 4.125% Euronotes 2007 – 688 – – – – 688
£350m 6.375% Eurobonds 2009 – – – 620 – – 620
£350m 5.625% Euronotes 2013 – – – – – 595 595
Perpetual Securities – 386 – – – – 386
Bank loans 1,358 – – – – – 1,358
Overdrafts 245 –––––245
Effect of interest rate swaps2825 (762) 495 (240) 291 (609) –
Other financial liabilities 37 2 – ––1251
Trade and other payables12,038 55 30 – 3 8 2,134
4,503 369 525 380 294 6 6,077
1. VAT and other tax payable of US$42m (2006: US$125m), social security costs of US$75m (2006: US$75m) and accruals of US$200m
(2006: US$231m) are excluded from this analysis.
2. These represent the gross notional values of interest rate swaps.
Introduction | Business review | Governance | Financial statements
Notes to the Group financial statements
for the year ended 31 March 2007
102 |Experian Annual Report2007